© Boule Medical AB, March 2018. Article no. 1504496 Page 41
5. Quality Control
Quality Assurance Functions
5 Print/Send Results To print a specic QC sample result, select Print.
To Send a specic QC sample result, select Export.
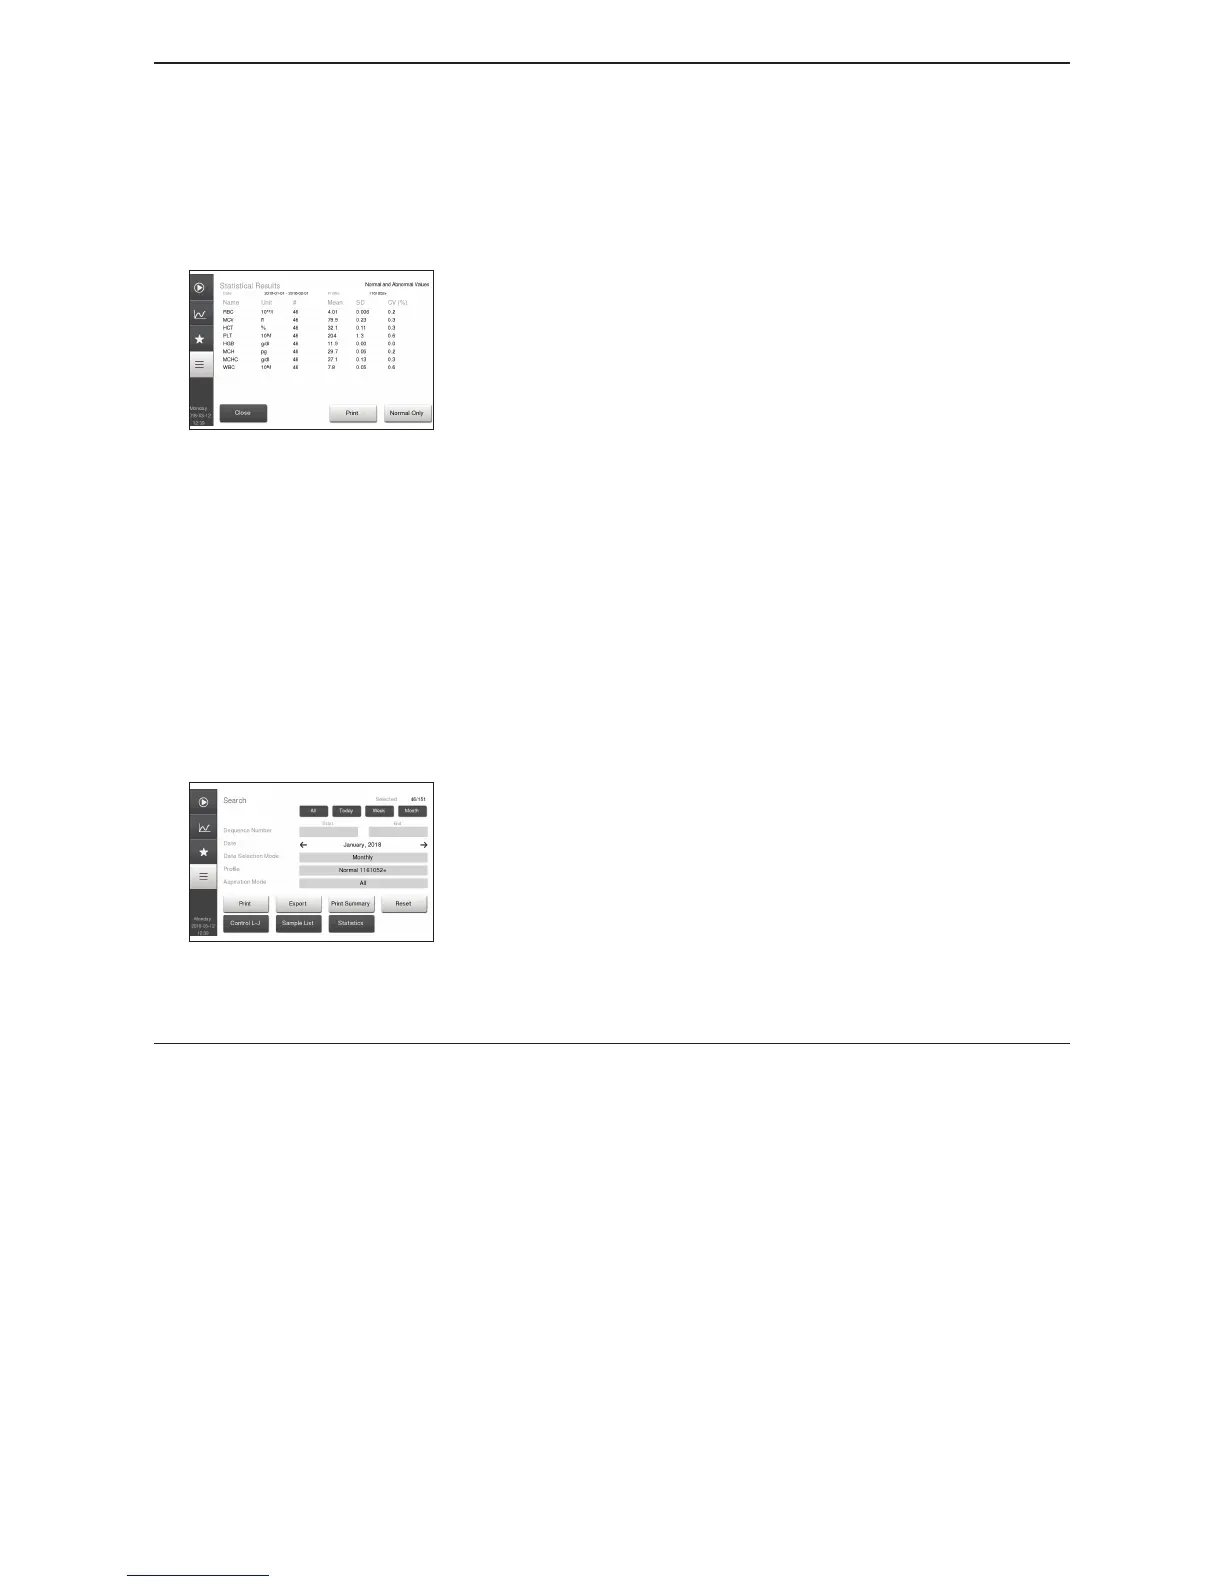
6 View QC Statistics
Figure 57: QC Statistics
For a quick view of all sample statistics press Statistics
button.
In the Sample Statistics Menu the operator will be able to
view:
− Parameter
− Number of samples used in statistics
− Mean value of selected samples
− Standard Deviation (SD) of selected samples
− Coecient of Variation (CV) of selected samples.
To view specied control lot, select samples using the
Search mode in Control L-J screen.
To view only normal statistic values, press Normal Only
button.
To exclude a specic sample from the statistics, uncheck the
box to the right of the sample when viewing it in Sample
List.
7 View Summary Reports
Figure 58: Summary Reports
Once QC samples are displayed they can also be printed out in
a Monthly QC summary report.
In Search menu, select Monthly under Date Selection and
then choose the desired control lot under Prole.
Select Print Summary button to print report.
8 Clear Search Results Search criteria are reset when leaving the function.
Levey-Jennings Plots
Levey-Jennings (L-J) plots are used to monitor the long term stability of the analyzer using Boule
controls. Plots are auto-scaled to the expected ranges dened in the assay. To select, display and/or
print the L-J plots, follow the instructions below: