Achieving a good image10
In automatic mode, the camera continuously adjusts the level and span for the best im-
age presentation. The colors are distributed based on the thermal content of the image
(histogram color distribution). The temperature scale to the right of the screen shows the
upper and lower temperatures of the current span.
In manual mode, you can adjust the temperature scale to values close to the temperature
of a specific object in the image. This will make it possible to detect anomalies and small-
er temperature differences in the part of the image of interest. In manual mode, the col-
ors are distributed evenly from the lowest to the highest temperature (linear color
distribution).
In manual mode, you can adjust the image by touching the screen or by using the naviga-
tion pad. For more information, see sections 10.3.2 Manual adjustment by touching the
screen and 10.3.3 Manual adjustment by using the navigation pad.
• In live mode, select
(Temperature scale) and then (Auto) or (Manual) to
enter automatic or manual image adjustment mode.
• In preview/edit mode, manual image adjustment mode is active.
Note You can also assign image adjustment functions to the programmable button. For
more information, see section 7.9 Programmable button.
• Switch between auto and manual: Allows you to switch between automatic and man-
ual image adjustment modes.
• Auto adjust the manual temperature scale: Allows you to perform an automatic adjust-
ment of the image while remaining in manual image adjustment mode.
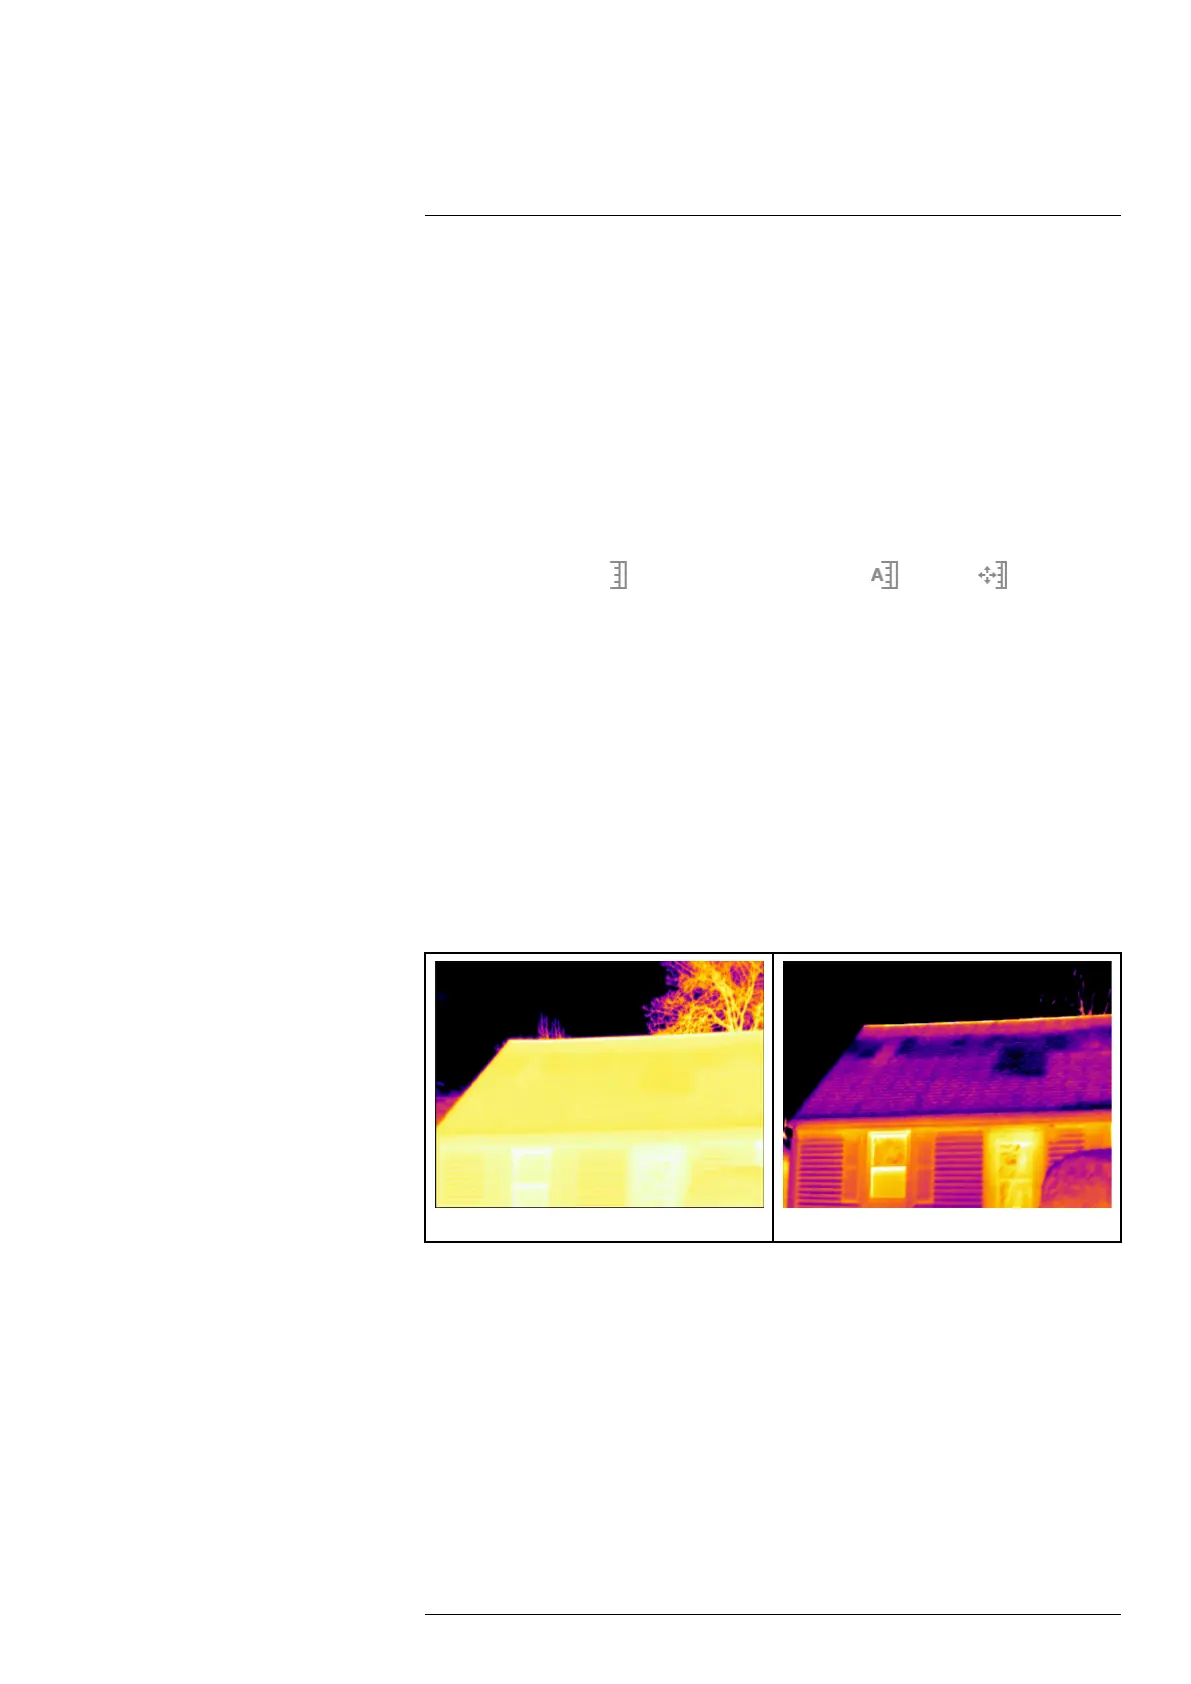
10.3.1.1 Example 1
Here are two infrared images of a building. In the left image, which is auto-adjusted, the
large temperature span between the clear sky and the heated building makes a correct
analysis difficult. You can analyze the building in more detail if you change the tempera-
ture scale to values close to the temperature of the building.
Automatic Manual
10.3.1.2 Example 2
Here are two infrared images of an isolator in a power line. To make it easier to analyze
the temperature variations in the isolator, the temperature scale in the right image has
been changed to values close to the temperature of the isolator.
#T810587; r. AA/74078/74713; en-US
50