OPERATION
APPLICATIONS
2>75.
Combined AC and DC
Signal
Measurements
2-76.
It is
sometimes
necessary to
measure
an ac signal
riding
on a
dc level. An example of this type of
signal is
shown
in
Figure
2-16.
To
obtain
an accurate
measurement
of
the total rms value for these
signals,
perform
the following steps:
1.
Measure the ac component of the signal
using
the AC
V
function.
2.
Measure the dc
component
of the signal
using
the DC V
function,
3.
Use
the following formula, with the
values
obtained in Steps 1 and
2,
to
determine the total
rms
value
of
the
signal:
Total
RMS
=
\/(ac
component
rms)^
+
(dc component)^
Value
2-77.
Affects of
Offset in AC
Measurements
2-78. Your
Multimeter is a true-rms-responding
multimeter,
and the display may
indicate a reading
of 1 to
2 digits
(because
of amplifier
noise)
when
the
input is
shorted in
the AC
V or AC mA
functions.
The
accuracy
of
your
Multimeter is not
affected
by
this internal offset even
when
measured
inputs
are at the specified floor of the
multimeter
(5%
of
the range
selected). When
the rms
value of the two
signals (internal
offset
and
5%
of range
input) is
calculated,
as in the following equation, the
insignificant effect
of the offset is
shown:
Total rms digits
=
\J2'^
10()^
=
100.02
The display of your
Multimeter will read
100
digits.
2-79.
Bandwidth
Limitations in
AC
Voitage
Measurements
2-80.
Signals
with rectangular waveforms contain
component
frequencies that are much higher than the
fundamental
frequency
used to describe them.
The
component
frequencies, for
rise
times less than 1
microsecond,
exceed
the
200
kHz bandwidth of your
Multimeter (and
will
produce a low
reading display).
For
example, a
10-kHz
square wave with a rise time
of
less
than 1
microsecond will produce a display reading that is
approximately
1%
low. This
error
will
be proportionally
higher for higher
frequency
square waves.
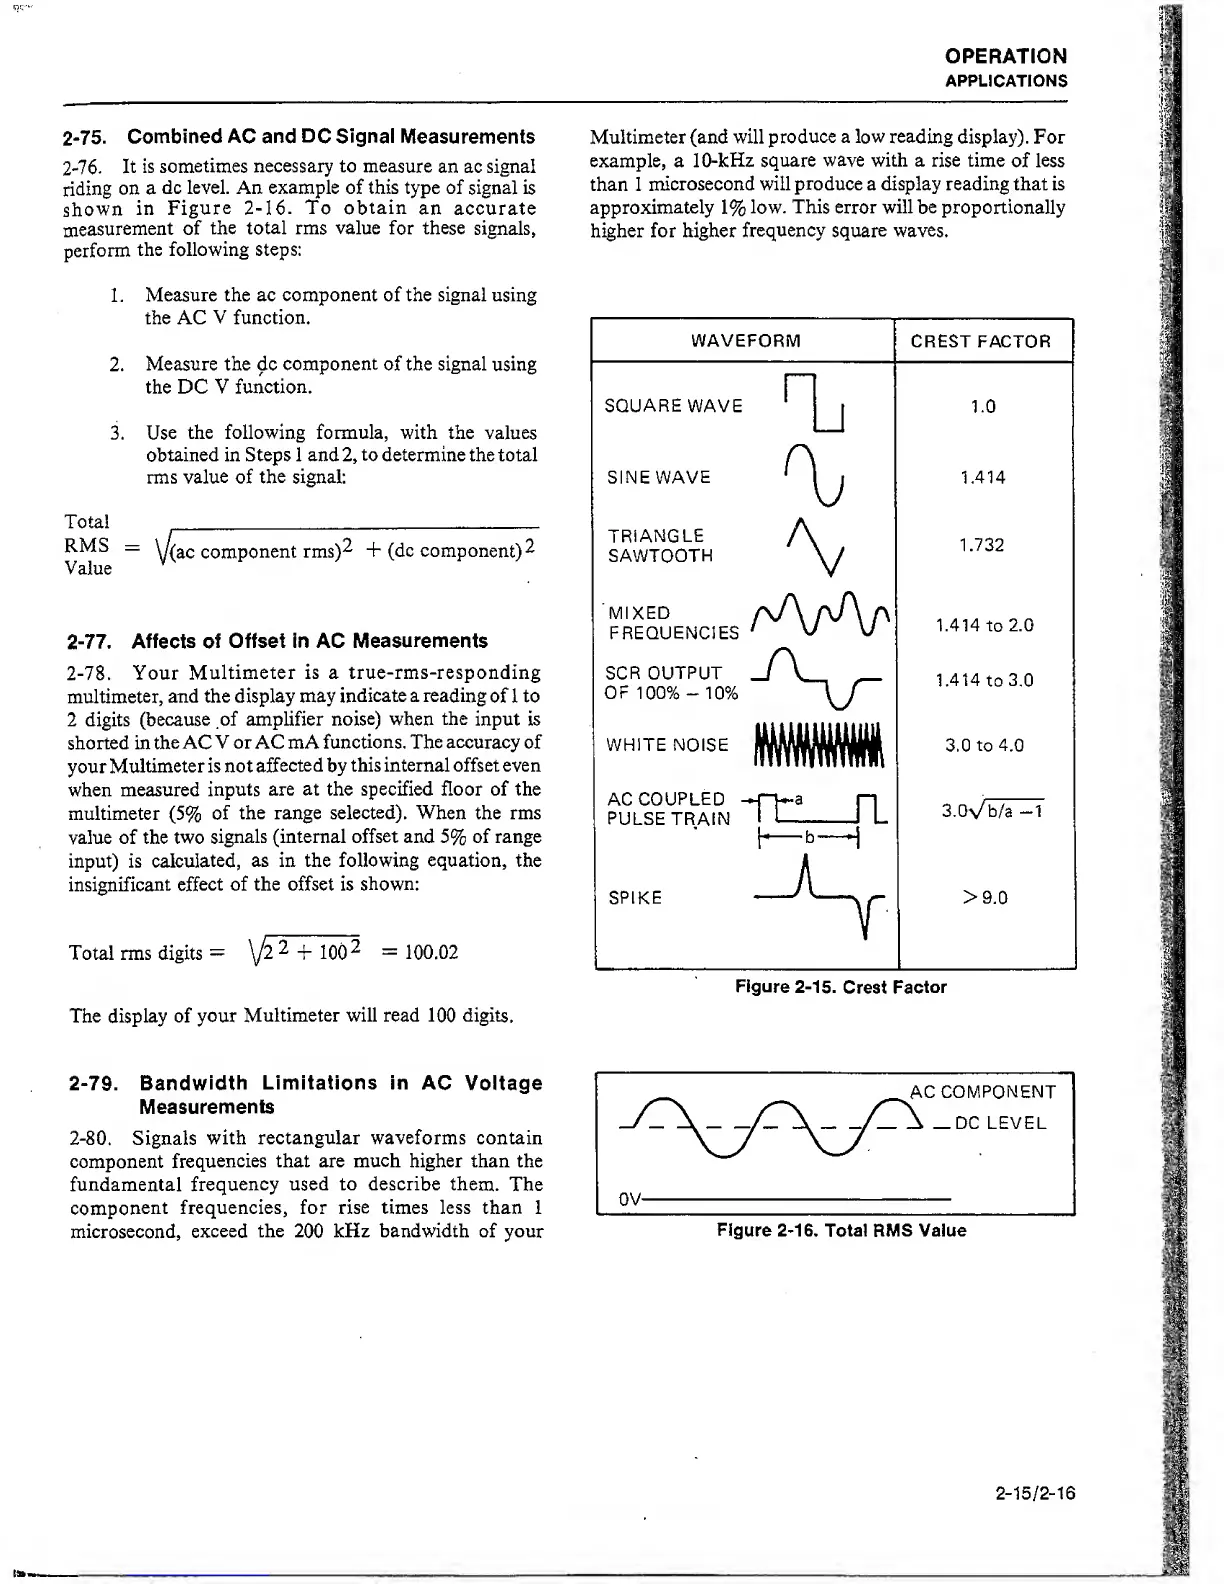
WAVEFORM
CREST FACTOR
SQUARE
WAVE
^
1.0
SINE
WAVE
%
1.414
TRIANGLE
SAWTOOTH
1.732
MIXED
FREQUENCIES
1.414
to
2.0
SCR OUTPUT
OF
100%
-
10%
~'\j~
1.414
to
3.0
WHITE NOISE
mm
3,0
to 4.0
AC
COUPLED
PULSE
TRAIN
n
3.0Vb/a
-1
j.
b"'
*1
SPIKE >9.0
Figure
2-15.
Crest
Factor
Figure
2-16.
Total RMS Value
2-15/2-16