Move the 10 MHz sinewave signal back to input A. Change
the measurement function to Period Single A. Now the S/R
flip-flop should not be used, check the control signal at R623,
it should be -1.6 V (on is -1.0 V). Select statistic s. The std de
-
viation should be less than 100 ps.
Change the measurement function to Time Interval A - A. Se
-
lect Statistics Mode. Check that the standard deviation is less
than 100 ps. Measure at pin 8 of the ADCs U23, U22, U21 and
U20. See Figure 6-100 for a typical timing diagram. Check
the upper (TP3) and lower (TP4) voltage limits of the ADCs.
They should be approximat e ly 3.5 - 3.6 V and 1.0 - 1.4 V. The
importa nt thing is that the lowest voltage pulse on any pin 8 of
the ADCs (U23, U22, U21, U20) should be at least 0.2 V
above the lower limit and that the highest voltage pulse on any
pin 8 of the ADCs should be at least 0.3 V below the upper
limit. If an interpolator has a voltage pulse outside the limi ts
the measurement result will be wrong. Figure 6-101 shows the
signals on an ADC.
The signal from the prescaler is connected to pin 22 (sin
-
gle-ended) of U11. It comes via a level converter. Check the
input signal to the converter at R335 (PECL levels).
If the FPGA or a part in the interpolators has been changed or
repaired, a calibration of internals must be performed after
-
wards. See Chapter 7.
6-56 Troubleshooting
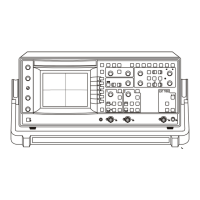
Figure 6-99 Important locations for the measuring logic.
R623
X4
X3
U11 U20
U21
U23
R335
U22
Figure 6-100 ADC 10461 behavior. Time A-A Smart, 10 MHz
in, block measurement.
U21:8
U20:8
U22:8
U23:8