52 | Description of the menu
Power Quality Controller – PQC | Operating Manual | FRAKO
An effective combination of “parallel shift” and “limitation” is illustrated in the following
diagram:
Control characteristic at
cosφ
target
=0.92 ind
Limitation = +1.0
Parallel shift = –1.0 (capacitive)
This example illustrates:
– In the “upper” power range,
the set cosφ
target
is specified
as the lower (more inductive)
limit value.
– Overcorrection is avoided in
the low load range.
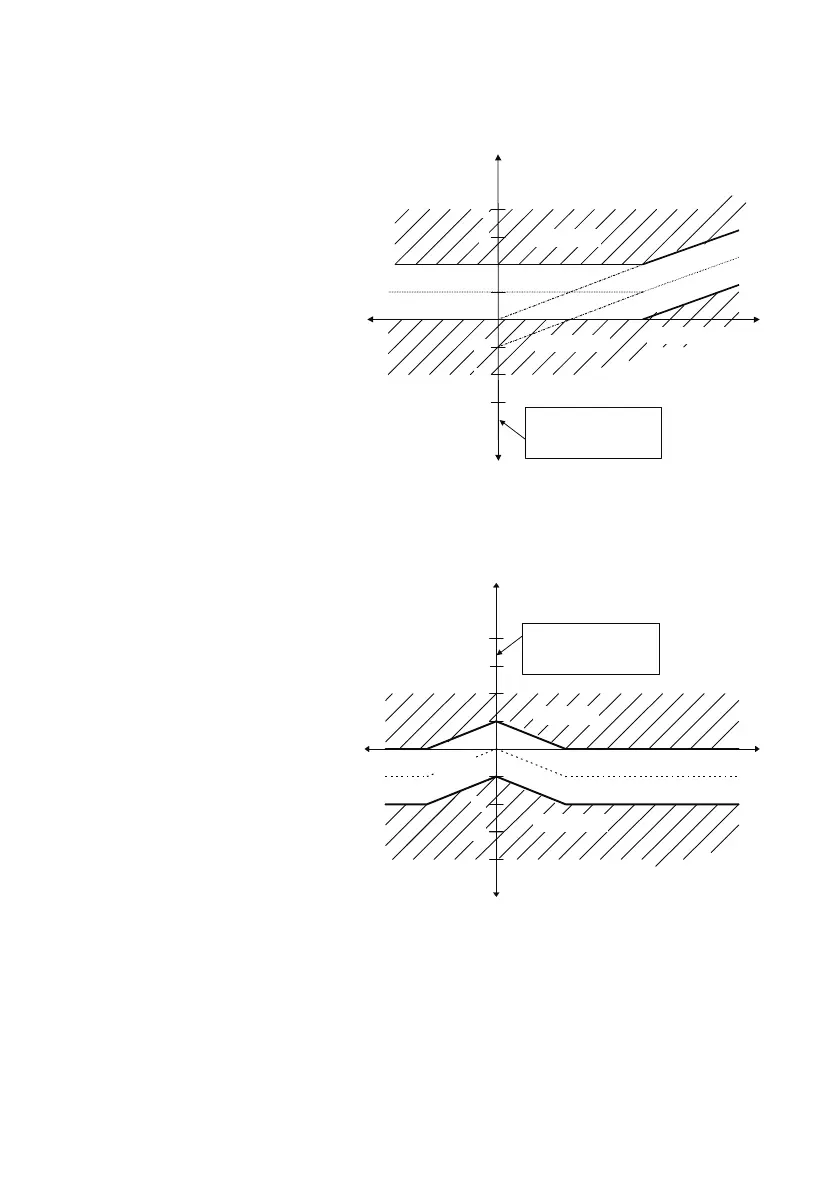
For the sake of completeness, the following diagram shows the characteristics of the
control band when set for a capacitive cosφ
target
. In this case, the control range does
not extend laterally at the reactive power axis into the regeneration quadrants, but is
mirrored from the power draw side into the regeneration side.
Control characteristic at
cosφ
target
= 0.95 cap
Limitation = –1.0
Parallel shift = 0
Switching delay
The switching delay, i.e. the time between one switching action and the next for the same
capacitor stage, can be set between the values of 5 and 500 seconds in 5-second incre-
ments. When a stage is to be switched in or out, the PQC waits for this switching delay to
elapse before switching takes place. If more stages are required, the switching time delay
is shortened in accordance with the number of stages concerned (e.g. 2 stages required
= switching delay time ÷ 2, or 3 stages required = switching delay time ÷ 3).
Active power
Reactive power
ind
cap
Regeneration
Switch in
Switch out
One division =
0.65 × smallest cap.
stage
-2
-3
4
3
-1
Active power
Reactive power
ind
cap
Regeneration
Switch in
Switch out
One division =
0.65 × smallest cap.
stage
-3
3
2
-2
Active power
Reactive power
ind
cap
Regeneration
Switch in
Switch out
One division =
0.65 × smallest cap.
stage
-2
-3
4
3
-1
Active power
Reactive power
ind
cap
Regeneration
Switch in
Switch out
One division =
0.65 × smallest cap.
stage
-3
3
2
-2