13-21-602 Page 50
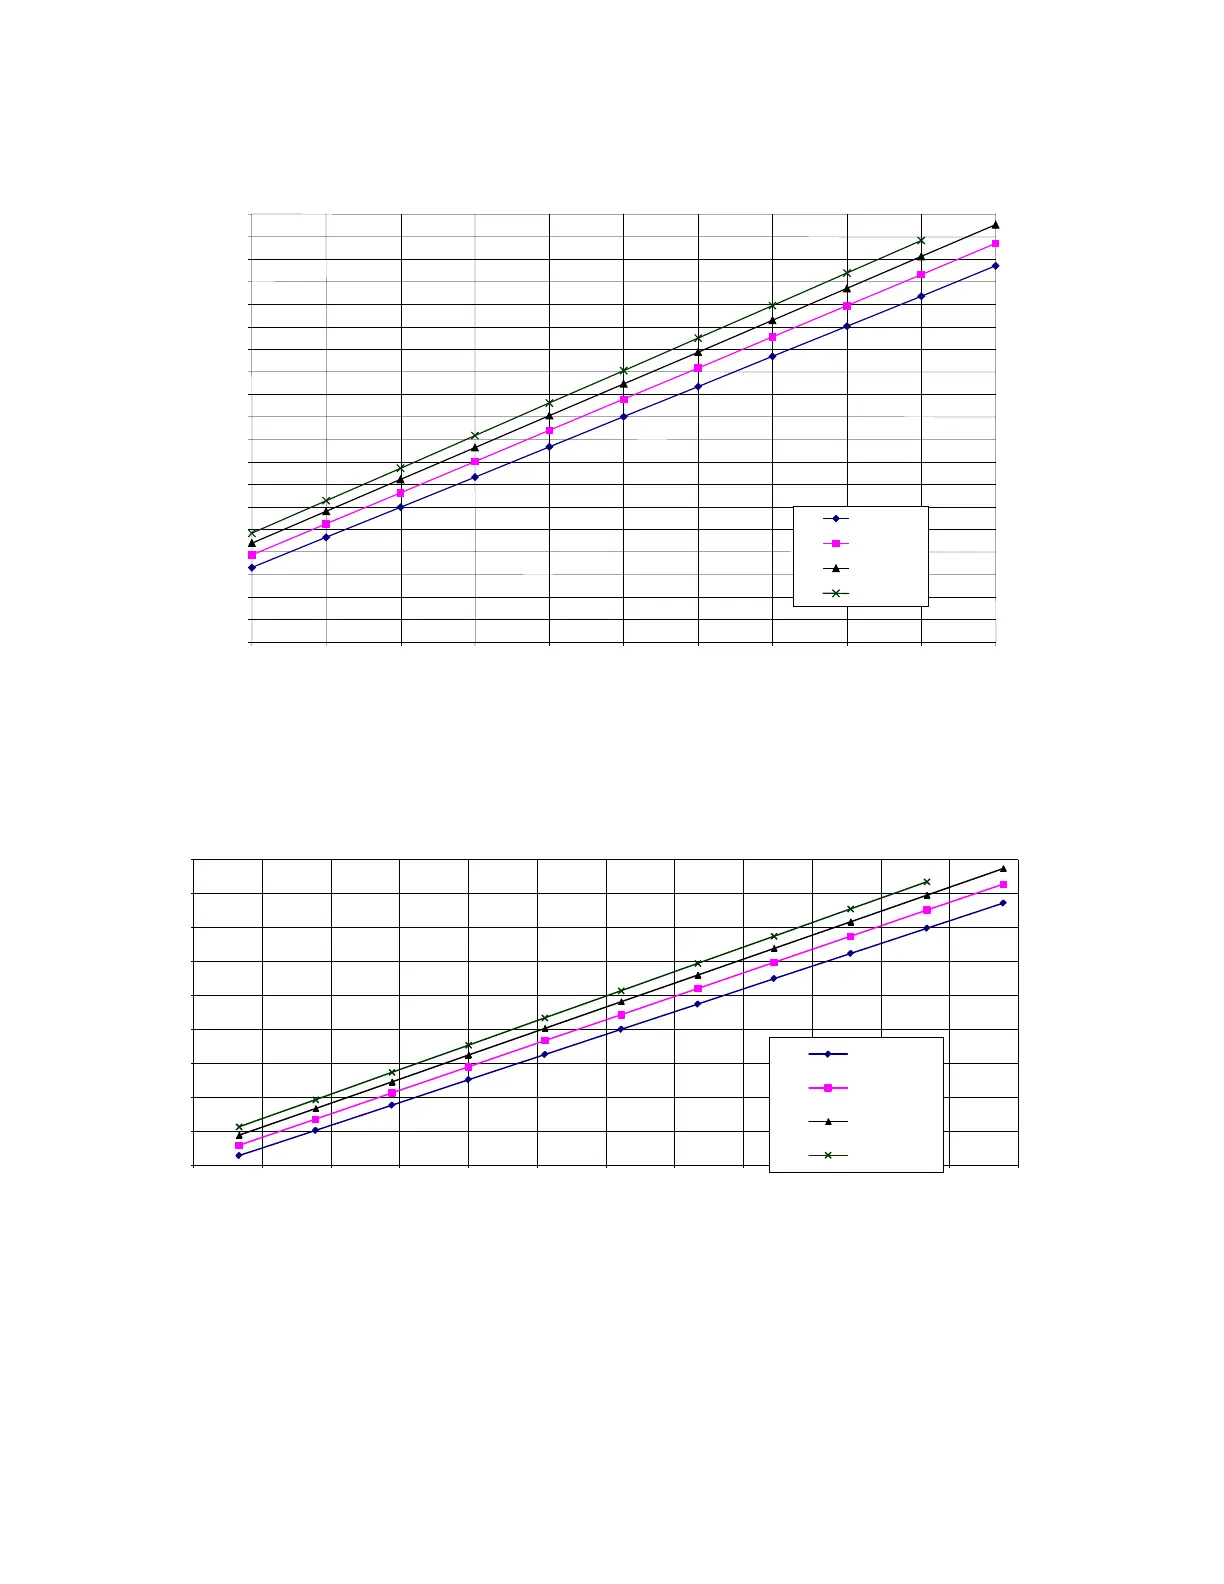
Dew-Point Temperature vs. Ambient Temperature
Figure 5-1 – DEW POINT CHART °F
Figure 5-2 – DEW POINT CHART °C
These charts are easily used by reading the ambient temperature along the bottom axis of the chart and then reading
the appropriate pressure curve to determine the corresponding dew-point temperature on the left axis of the chart.
The compressor discharge temperature must be maintained at a minimum of
10° F above this dew-point temperature
to prevent condensation accumulation in the lubricant reservoir. These charts assume 100% relative humidity.
20
30
40
50
60
70
80
90
100
110
-10 -5 0 5 10 15 20 25 30 35 40 45 50
Dew-Point Temp. C
Ambient Temp. C
Dew-Point Temperature vs. Ambient Temperature
(100% Relative Humidity)



 To Next Page