Vertical Oscillation: The amount of bounce while you are running. The vertical motion of your torso, measured
in centimeters for each step.
Vertical Ratio: The ratio of vertical oscillation to stride length.
About Heart Rate Zones
Many athletes use heart rate zones to measure and increase their cardiovascular strength and improve their level
of fitness. A heart rate zone is a set range of heartbeats per minute. The five commonly accepted heart rate
zones are numbered from 1 to 5 according to increasing intensity. Generally, heart rate zones are calculated
based on percentages of your maximum heart rate.
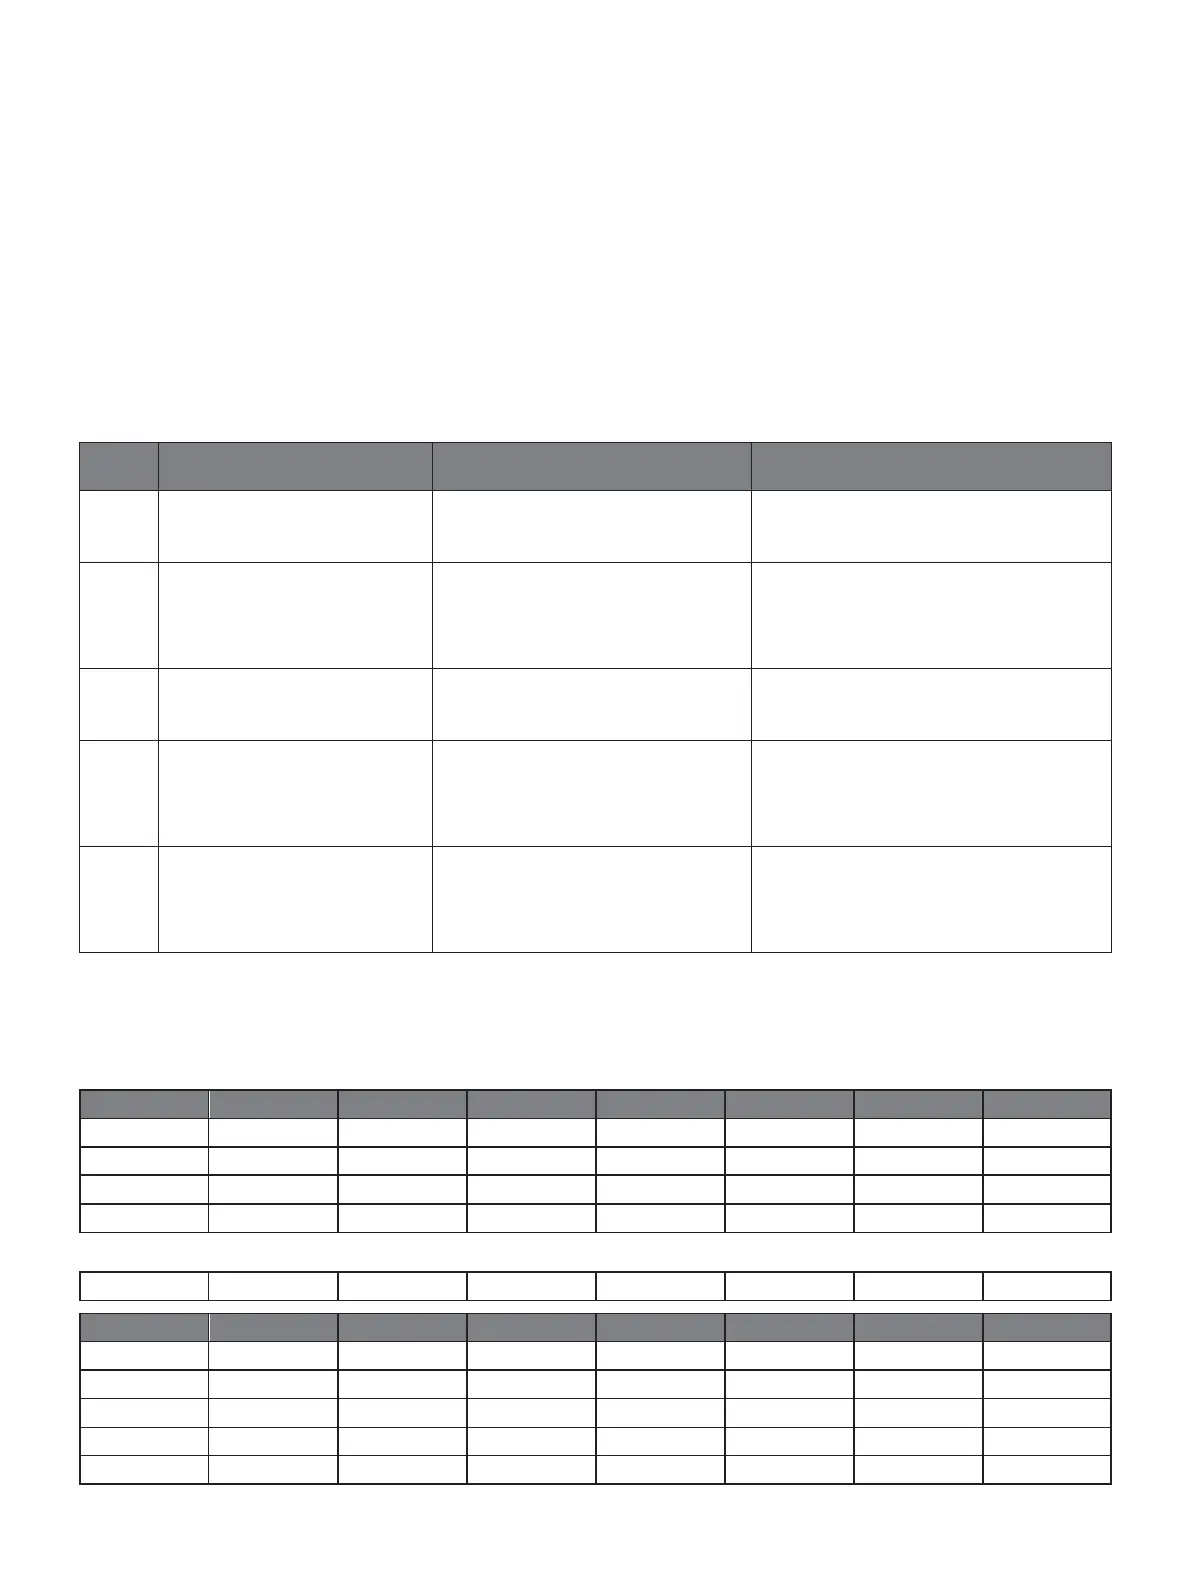
Heart Rate Zone Calculations
Relaxed, easy pace, rhythmic
breathing
Beginning-level aerobic training,
reduces stress
Comfortable pace, slightly
deeper breathing, conversation
possible
Basic cardiovascular training, good
recovery pace
Moderate pace, more difficult
to hold conversation
Improved aerobic capacity,
optimal cardiovascular training
Fast pace and a bit
uncomfortable, breathing
forceful
Improved anaerobic capacity
and threshold, improved speed
Sprinting pace, unsustainable
for long period of time,
labored breathing
Anaerobic and muscular
endurance, increased power
V
O2
Max
�
Standard Ratings
These tables include standardized classifications for VO2 max. estimates by age and gender.
Data reprinted with permission from The
Cooper Institute. For more information, go to