GE Analytical Instruments ©2006 8-16 DLM 14291 Rev. A
Vital Capacity
Deadspace Discard
1 2 4 6 8 24 48
4
5
6
7
8
9
10
*
*
*
TIME (hours)
1 4 8 12 24
10
11
12
13
*
TIME (hours)
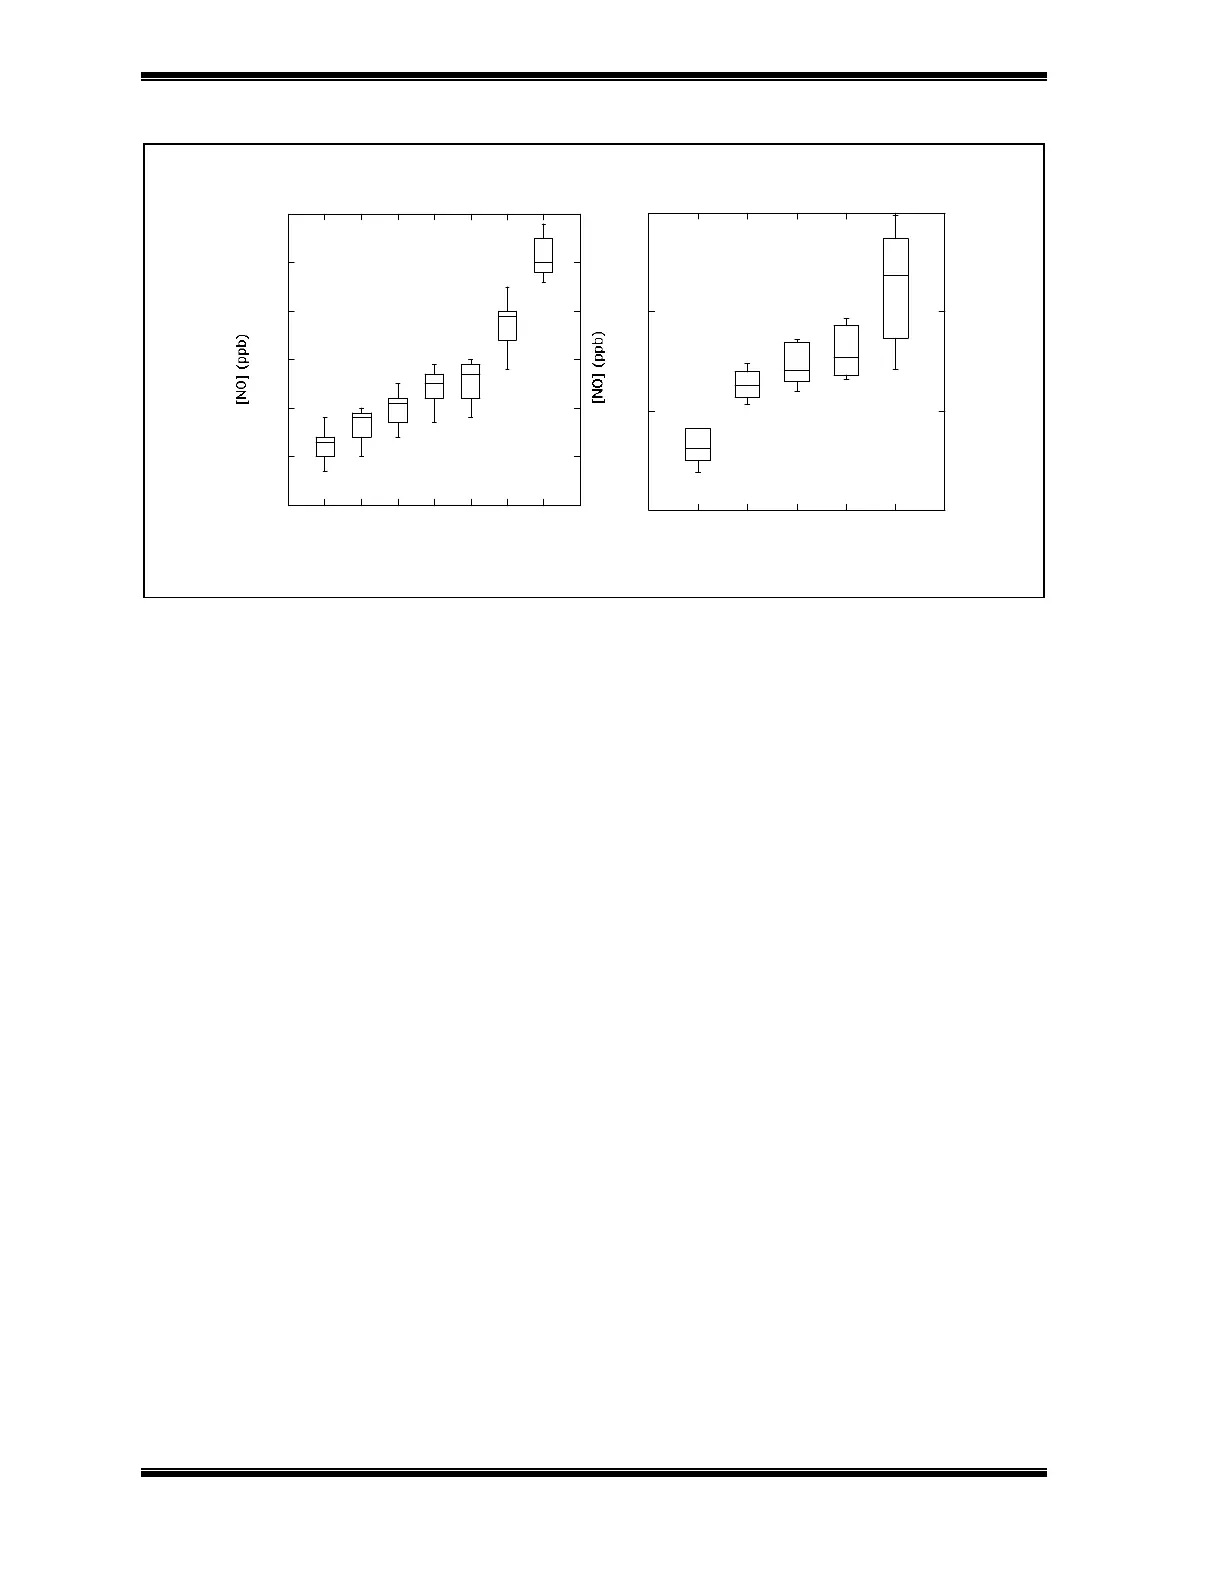
Fi
ure 8- 7: Box Plots showin
Stabilit
on NO in Ba
s.
increase continues as long as the samples are stored in the bag, reaching ~ 5 ppb
after 48 hours.
Examples of the observed increase are shown in Figure 8-7. For these tests, a
single subject filled multiple bags (13 Vital Capacity Bags, 6 Deadspace Discard
Bags), which were then analyzed over time. In these box plots, the median value
(the middle value in an ordered listing of the data) is the center line of the box,
the box is the interquartile range (2
nd
and 3
rd
quartiles) and includes half of the
measurements. The “hinges” are 1.5 times the interquartile range and outliers are
identified using asterisks (outside of ± 1.5 times the interquartile range) or open
circles (outside of ± 3 times the interquartile range).
There are a couple of reasons for this observed increase. Bags filled with NO-free
air show a small increase (~1 ppb in 24 hours), which suggests that NO or some
other chemical that undergoes a chemiluminescent reaction with ozone is coming
from the bags. Bags containing exhaled breath show an additional increase due
conversion of nitrite or some other component of exhaled breath or breath
condensate to NO.
One way to monitor possible increases in the concentration of NO in the bags,
particularly when there is a long time between collection and analysis of samples