1–8 EPM 2200 POWER METER – INSTRUCTION MANUAL
POWER, ENERGY AND DEMAND CHAPTER 1: THREE-PHASE POWER MEASUREMENT
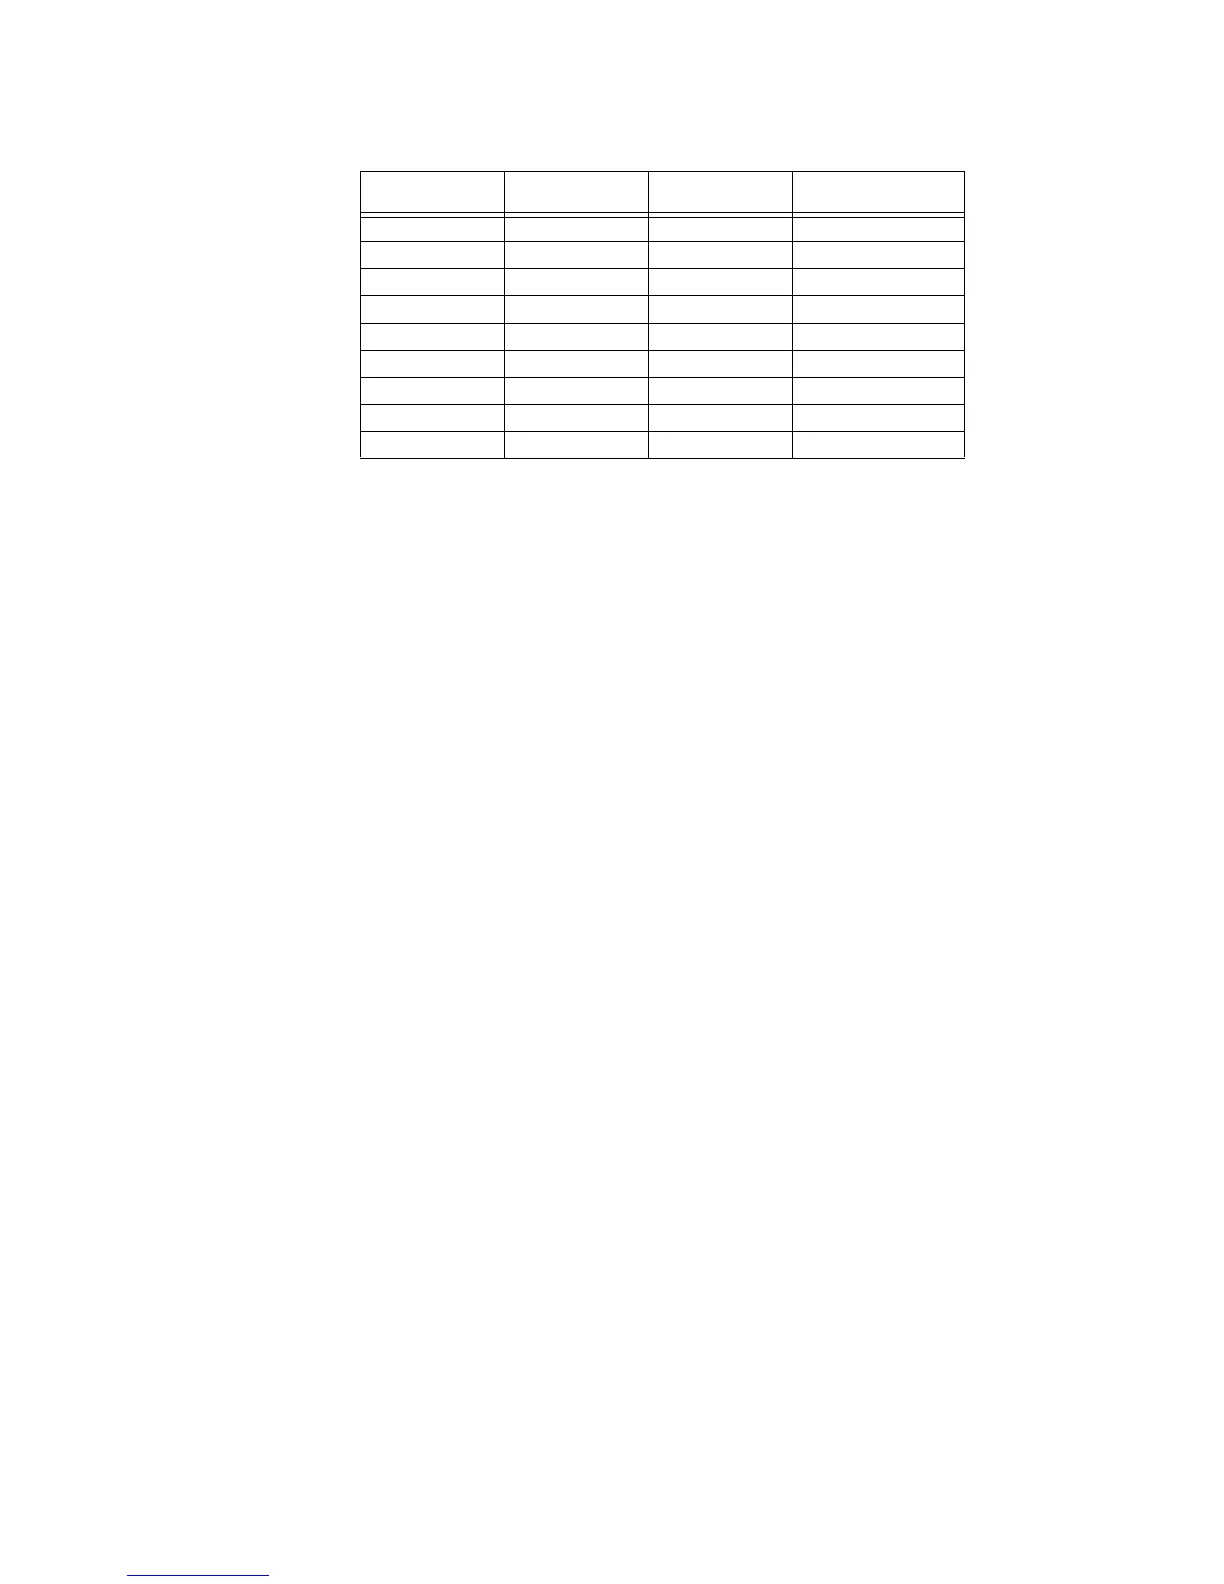
As in Table 1.2, the accumulated energy for the power load profile of Figure 1.7 is
14.92 kWh.
Demand is also a time-based value. The demand is the average rate of energy use
over time. The actual label for demand is kilowatt-hours/hour but this is normally
reduced to kilowatts. This makes it easy to confuse demand with power, but demand
is not an instantaneous value. To calculate demand it is necessary to accumulate the
energy readings (as illustrated in Figure 1.7) and adjust the energy reading to an
hourly value that constitutes the demand.
In the example, the accumulated energy is 14.92 kWh. But this measurement was
made over a 15-minute interval. To convert the reading to a demand value, it must be
normalized to a 60-minute interval. If the pattern were repeated for an additional
three 15-minute intervals the total energy would be four times the measured value or
59.68 kWh. The same process is applied to calculate the 15-minute demand value.
The demand value associated with the example load is 59.68 kWh/hr or 59.68 kWd.
Note that the peak instantaneous value of power is 80 kW, significantly more than the
demand value.
Figure 1.8 shows another example of energy and demand. In this case, each bar
represents the energy consumed in a 15-minute interval. The energy use in each
interval typically falls between 50 and 70 kWh. However, during two intervals the
energy rises sharply and peaks at 100 kWh in interval number 7. This peak of usage
will result in setting a high demand reading. For each interval shown the demand
value would be four times the indicated energy reading. So interval 1 would have an
associated demand of 240 kWh/hr. Interval 7 will have a demand value of 400 kWh/
hr. In the data shown, this is the peak demand value and would be the number that
would set the demand charge on the utility bill.
7701.176.09
8701.177.26
9601.008.26
10 70 1.17 9.43
11 80 1.33 10.76
12 50 0.83 12.42
13 50 0.83 12.42
14 70 1.17 13.59
15 80 1.33 14.92
Table 1.2: Power and Energy Relationship over Time
Time Interval
(minute)
Power (kW) Energy (kWh) Accumulated Energy
(kWh)
 Loading...