6–22 PQM POWER QUALITY METER – INSTRUCTION MANUAL
POWER ANALYSIS CHAPTER 6: SOFTWARE
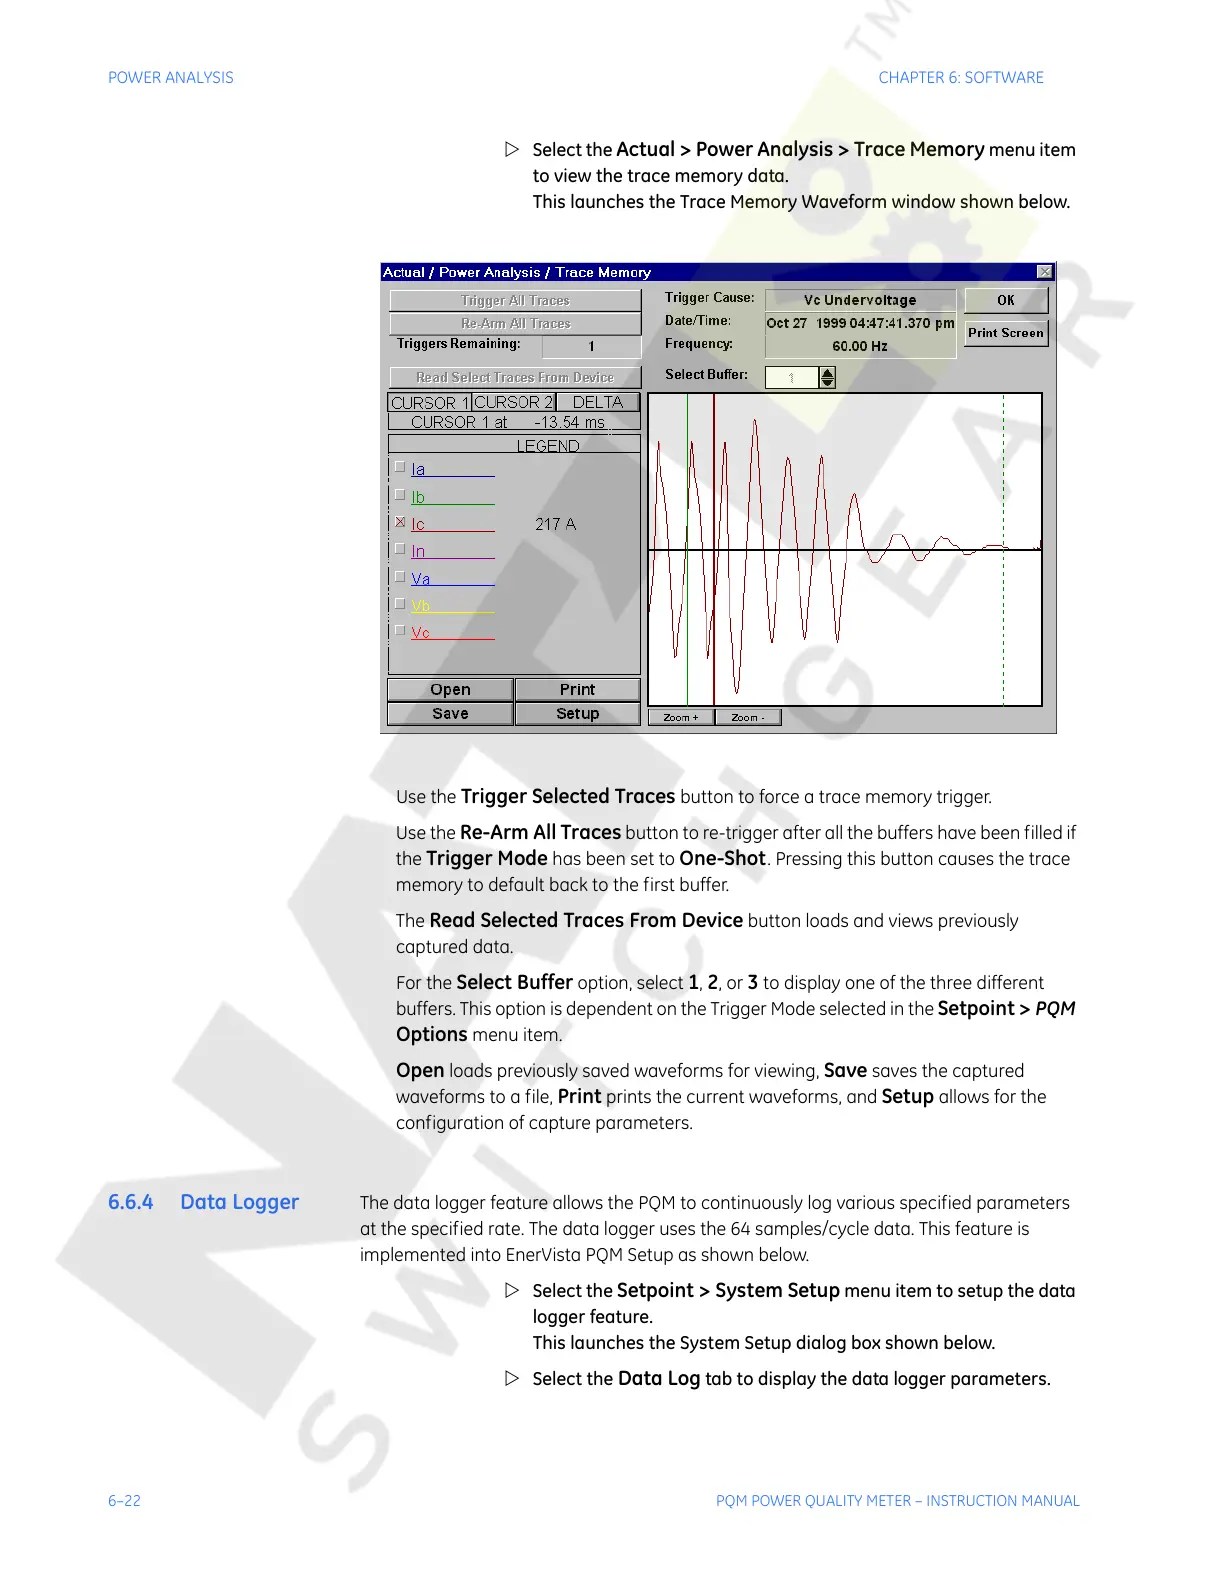
Z Select the Actual > Power Analysis > Trace Memory menu item
to view the trace memory data.
This launches the Trace Memory Waveform window shown below.
Use the
Trigger Selected Traces button to force a trace memory trigger.
Use the
Re-Arm All Traces button to re-trigger after all the buffers have been filled if
the
Trigger Mode has been set to One-Shot. Pressing this button causes the trace
memory to default back to the first buffer.
The
Read Selected Traces From Device button loads and views previously
captured data.
For the
Select Buffer option, select 1, 2, or 3 to display one of the three different
buffers. This option is dependent on the Trigger Mode selected in the
Setpoint > PQM
Options
menu item.
Open loads previously saved waveforms for viewing, Save saves the captured
waveforms to a file,
Print prints the current waveforms, and Setup allows for the
configuration of capture parameters.
6.6.4 Data Logger The data logger feature allows the PQM to continuously log various specified parameters
at the specified rate. The data logger uses the 64 samples/cycle data. This feature is
implemented into EnerVista PQM Setup as shown below.
Z Select the
Setpoint > System Setup menu item to setup the data
logger feature.
This launches the System Setup dialog box shown below.
Z Select the
Data Log tab to display the data logger parameters.
Courtesy of NationalSwitchgear.com