Owner’s Manual for Power Zone Pro Main Controller 23
Installation and Operation
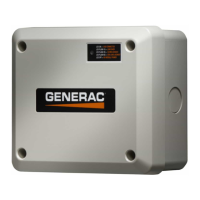
Top Banner
See Figure 3-4. The Top Banner is displayed on every
page and contains information about the generator’s
status.
A
B
C D
E
009397
Figure 3-4. Top Banner
A Shows the keyswitch position as follows:
• Red - OFF
• Green - AUTO
• Orange - MANUAL
If the display loses communications, the icon
will be flashing and the data will be frozen with
the last readings displayed.
B Indicates an emissions related problem with the
engine that requires attention.
C Represents an alarm (red), and is only
displayed when an alarm is present.
D Represents a warning (yellow), and is only
displayed when a warning is present.
E Indicates the total number of hours the
generator has run.
Data Area
The Data Area is the central area that changes
depending on which buttons are pressed. The menu
buttons are used to navigate to these pages. The right
side of the data area shows two arrows. Moving a finger
up and down between the arrows scrolls the page up and
down to show more data. Figure 3-5 shows how scrolling
on the “Engine” page brings up more engine bargraphs.
009398
Figure 3-5. Scrolling
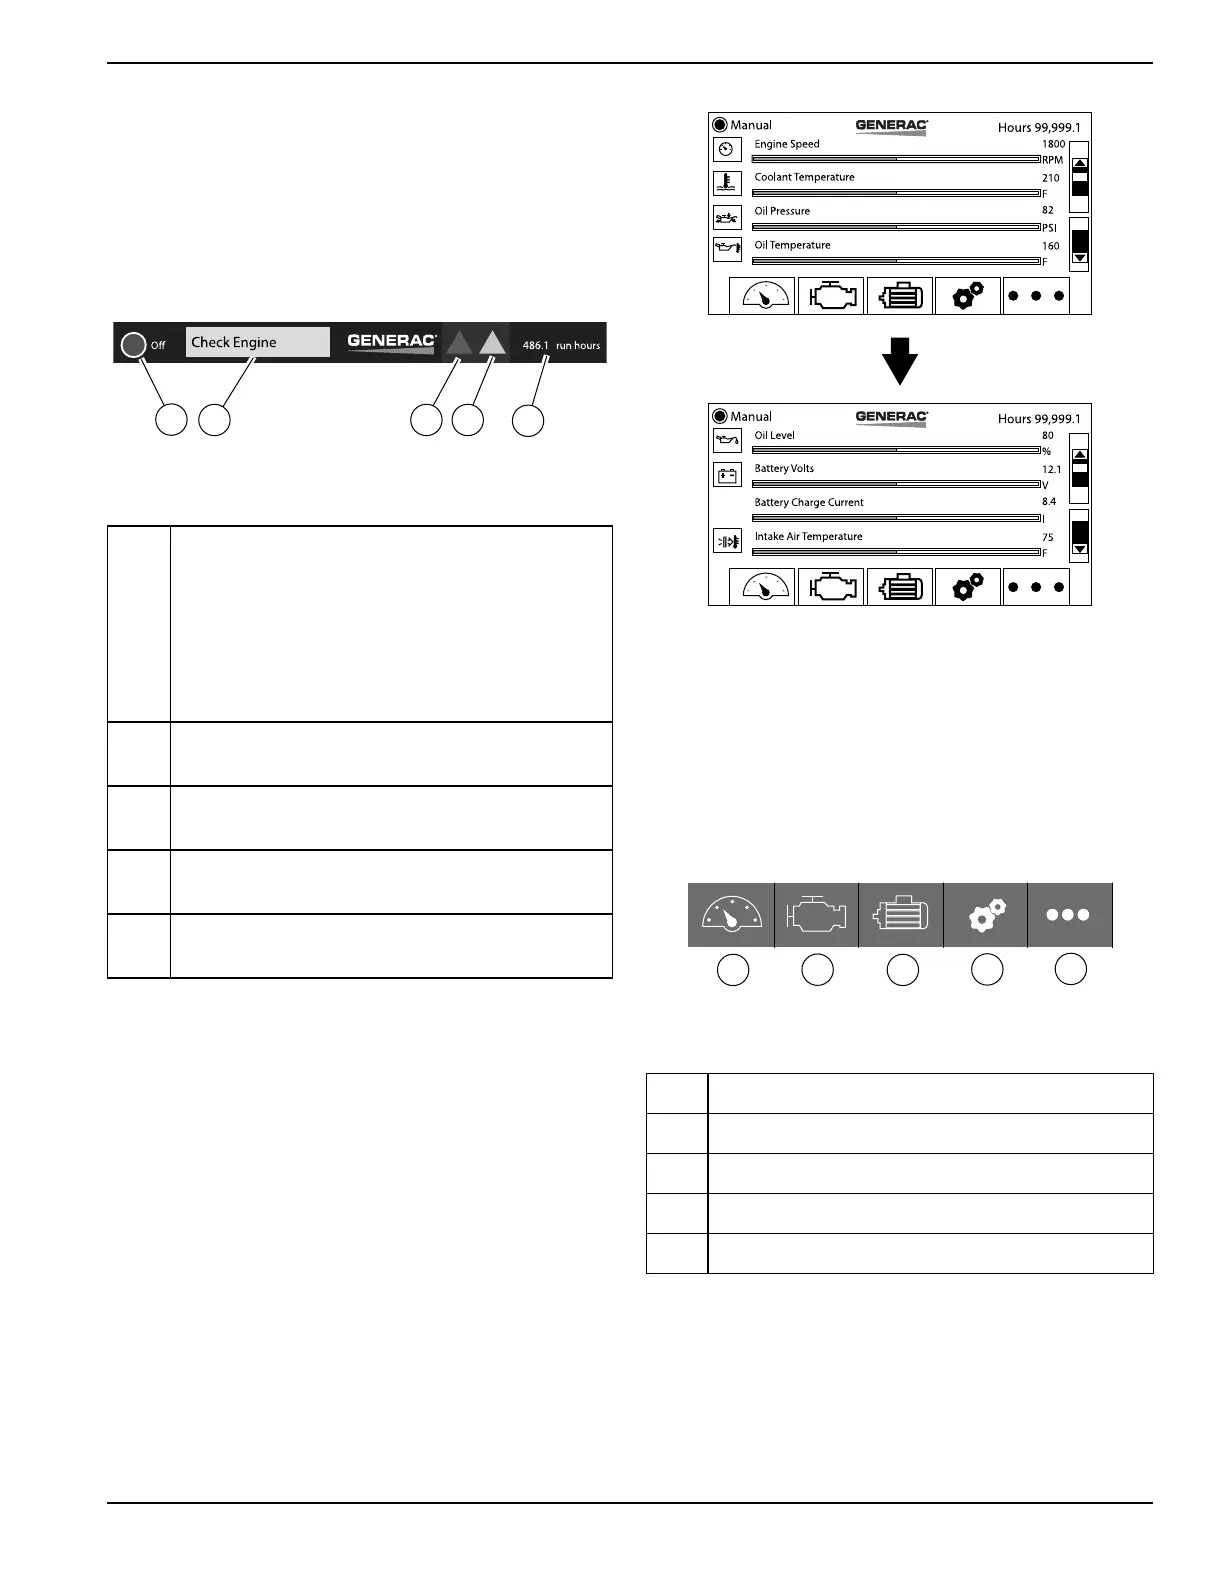
Bottom Banner (Menu Buttons)
See Figure 3-6. The Bottom Banner is displayed on
every page and is made up of menu buttons. Each menu
button navigates to a new page. The “More” button (E)
brings up additional menu buttons, shown in Figure 3-7.
NOTE:
There is currently one blank (unused) menu button
(I).
A
B
C
D
E
009399
Figure 3-6. First Set of Buttons
A Dashboard
B Engine
C Alternator
D System Details
E More