HP D300 Digital Dispenser
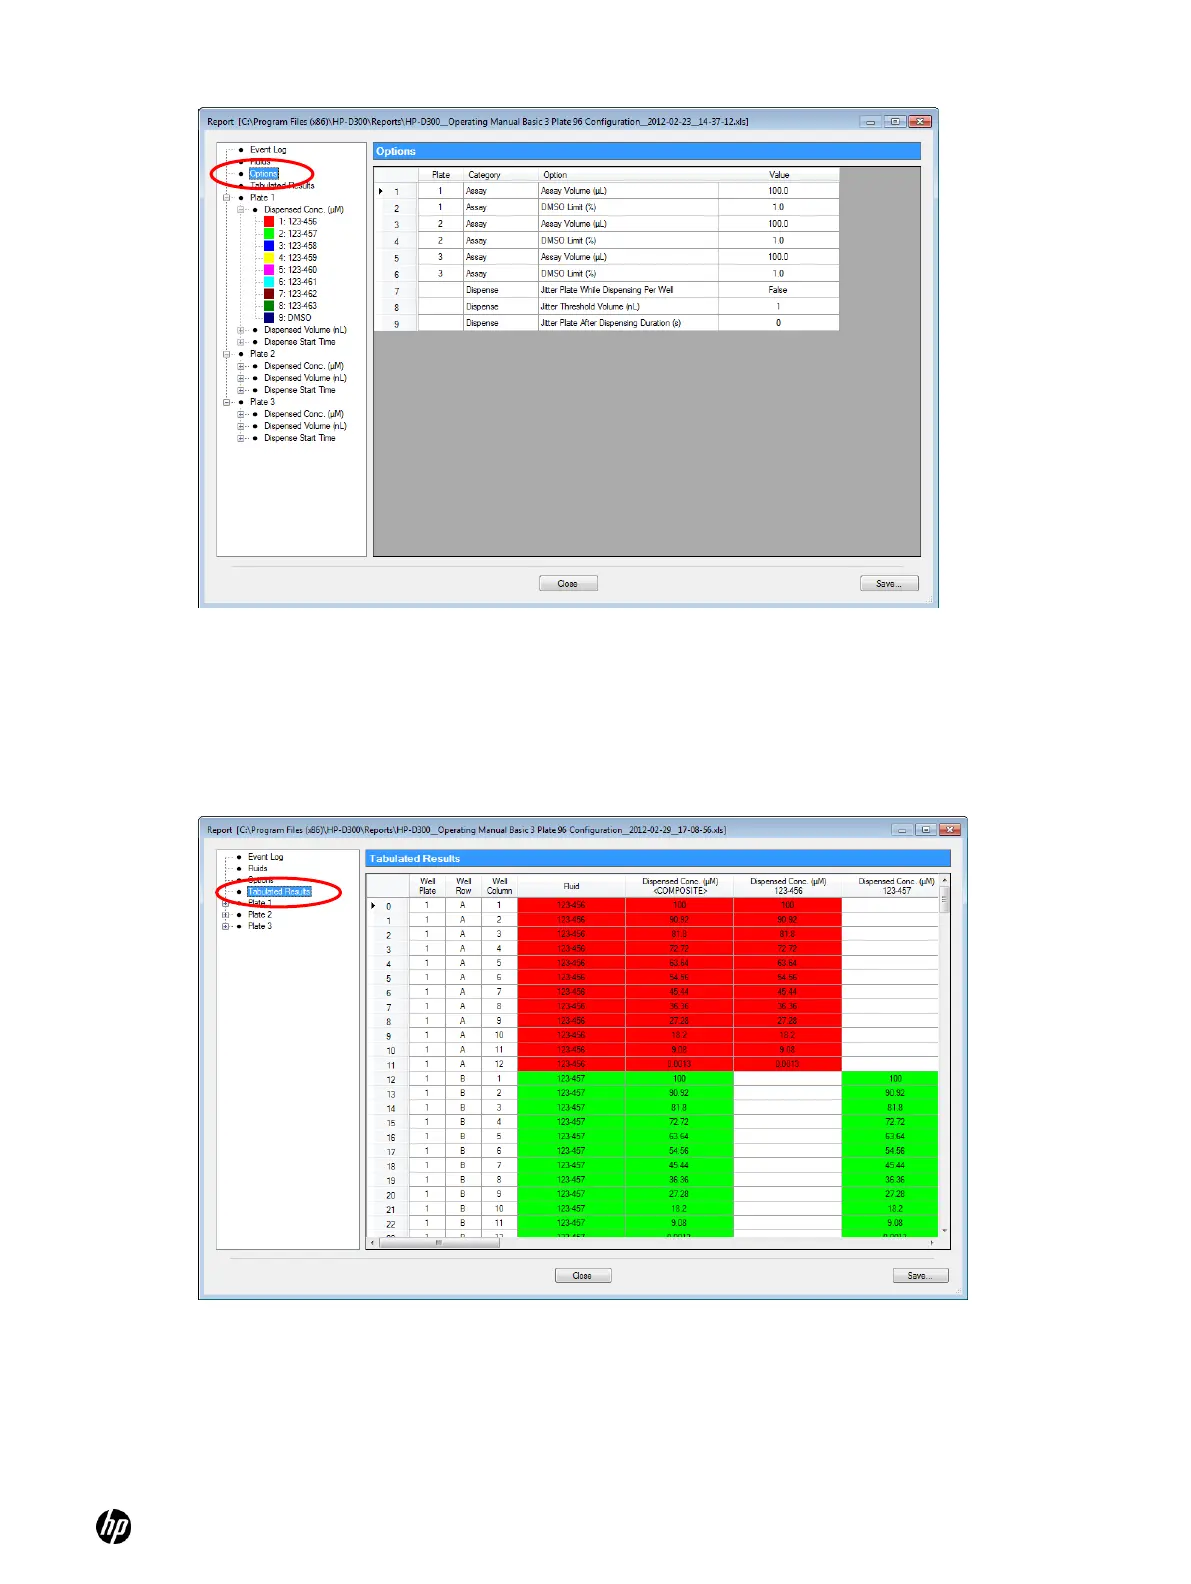
Figure 4-30 Report Options sheet
While most data is displayed in rectangular plate format, the Tabulated Results pane displays
concentration data in long skinny columns in order to sort randomized plates. See Figure 4-31.
To derandomize your data in order to create IC50 or EC50 plots, use this report file saved in Excel
format, and add a column of your plate reader data also in this long skinny format. Next, sort the
data by fluid name and concentration in order to process or plot the data by compound and
concentration.
Figure 4-31 Tabulated Results pane
Any previously saved report must be viewed in Excel. If you have trouble finding the reports, the
folder that the last report was saved in is listed in the Report pane of the Options dialog box (click
Setup, then Options…, and then Report).