EasyManua.ls Logo

HP HP-18C - Curve Fitting and Forecasting

HP HP-18C
226 pages
To Next Page IconTo Next Page
To Previous Page IconTo Previous Page
Loading...
BEl
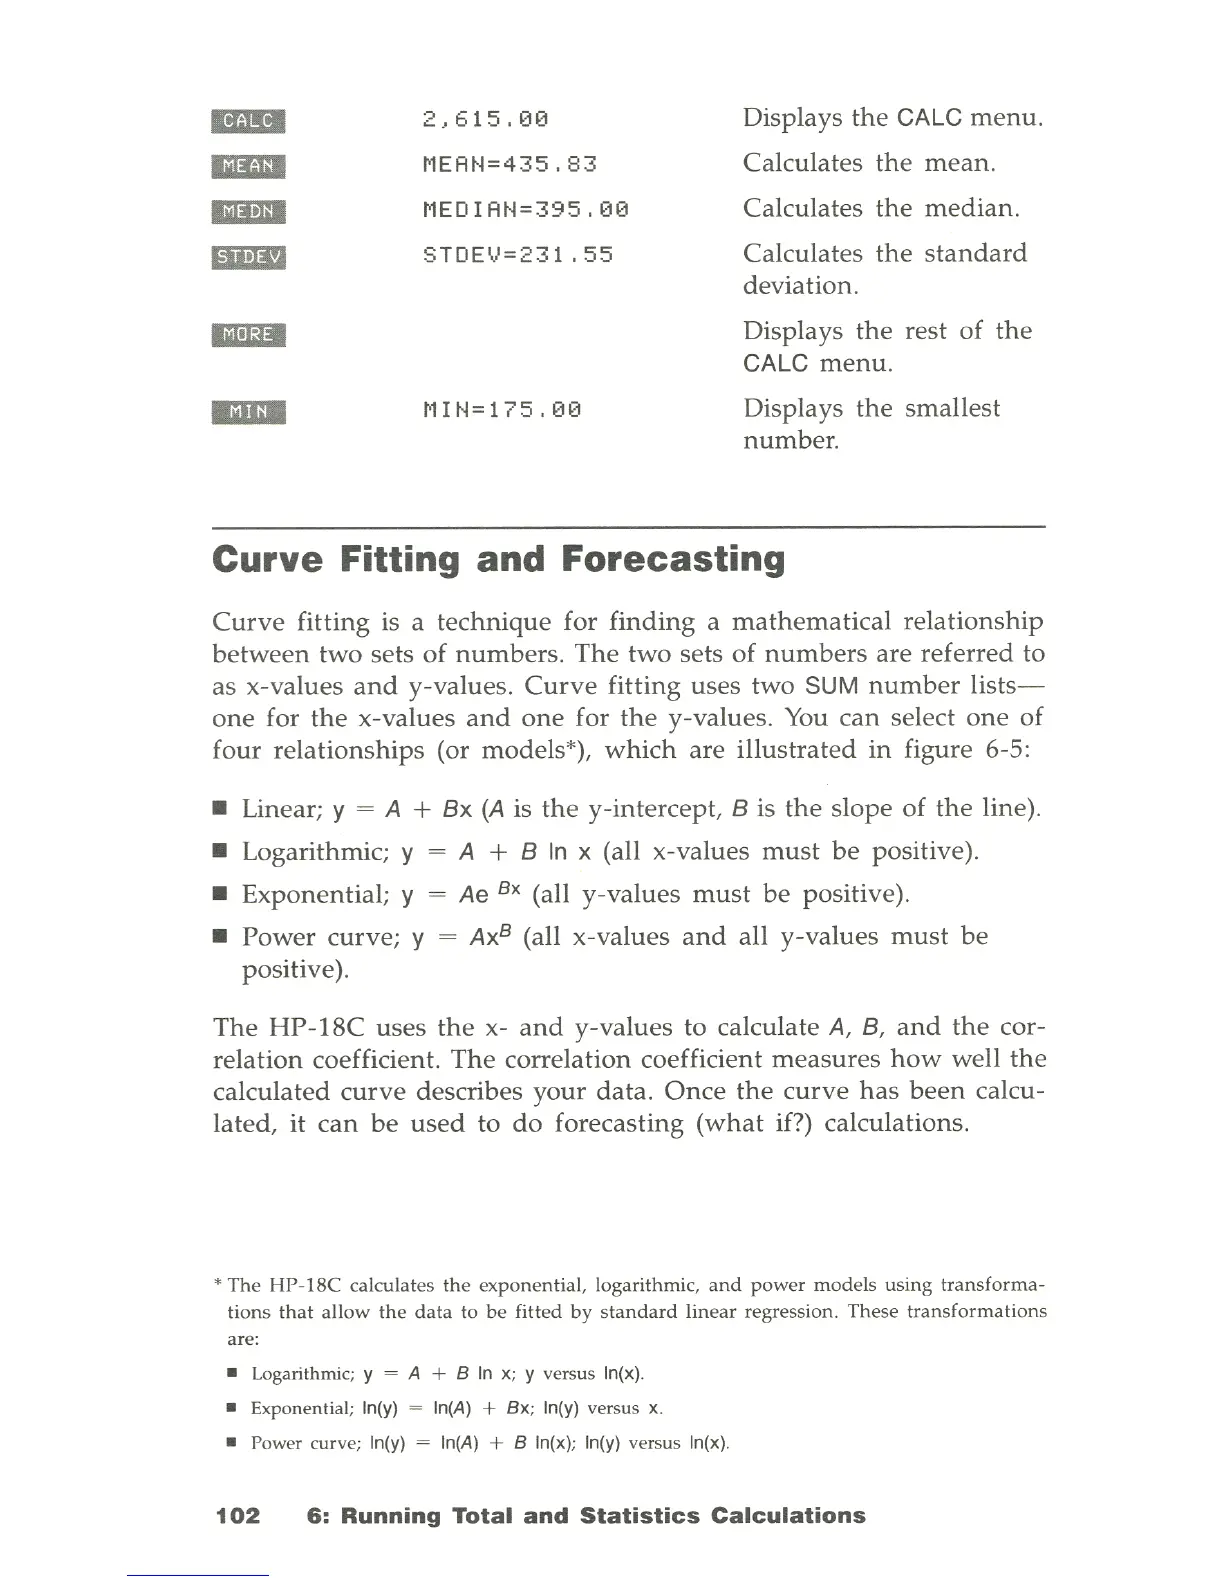
2,615,00
Displays
the
CALC
menu
.
IBDI
~lEA~1=435,
83
Calculates
the
mean.
..
MEDIAN=395,00
Calculates
the
median
.
IiiID
STDEV=231,55
Calculates
the
standard
deviation.
..
Displays
the
rest of
the
CALC
menu.
..
~lIN=175,00
Displays
the
smallest
number.
Curve Fitting and Forecasting
Curve
fitting is a
technique
for
finding
a
mathematical
relationship
between
two sets
of
numbers.
The
two sets of
numbers
are referred to
as x-values
and
y-values.
Curve
fitting uses two
SUM
number
lists-
one
for
the
x-values
and
one
for
the
y-values.
You
can
select
one
of
four
relationships
(or models*),
which
are
illustrated
in
figure 6-5:
Linear;
y = A +
ax
(A
is
the
y-intercept, a is
the
slope of
the
line).
Logarithmic;
y A + a
In
x (all x-values
must
be
positive).
Exponential;
y
Ae
Bx (all y-values
must
be
positive).
Power
curve; y =
AxB
(all x-values
and
all y-values
must
be
positive).
The
HP-18C
uses
the
x-
and
y-values to calculate
A,
a,
and
the
cor-
relation coefficient.
The
correlation coefficient
measures
how
well
the
calculated
curve
describes
your
data.
Once
the
curve
has
been
calcu-
lated, it
can
be
used
to
do
forecasting
(what
if?) calculations.
The
HP-18C
calculates
the
exponential, logarithmic,
and
power
models
using
transforma-
tions
that
allow
the
data
to
be
fitted
by
standard
linear
regression. These
transformations
are:
Logarithmic; y
~
A + B
In
x;
y versus
In(x).
Exponential;
In(y)
~
In(A)
+ Bx;
In(y)
versus
x.
Power curve;
In(y)
~
In(A)
+ B
In(x)
;
In(y)
versus
In(x).
102
6:
Running
Total
and
Statistics
Calculations

Table of Contents

Related product manuals