EasyManua.ls Logo

HP HP-18C - Cash Flow Diagrams and Signs of Numbers

HP HP-18C
226 pages
To Next Page IconTo Next Page
To Previous Page IconTo Previous Page
Loading...
Cash Flow Diagrams and Signs
of
Numbers
It
is
helpful
to illustrate TVM calculations
with
cash
flow
diagrams
.
Cash
flow
diagrams
are
time
lines
divided
into
equal
segments
of
time
called payment
periods
or
compounding
periods.
Arrows
show
the
cash
flows.
Money
received is a positive
number,
and
the
arrow
points
up
.
Money
paid
out
is a
negative
number,
and
the
arrow
points
down
.
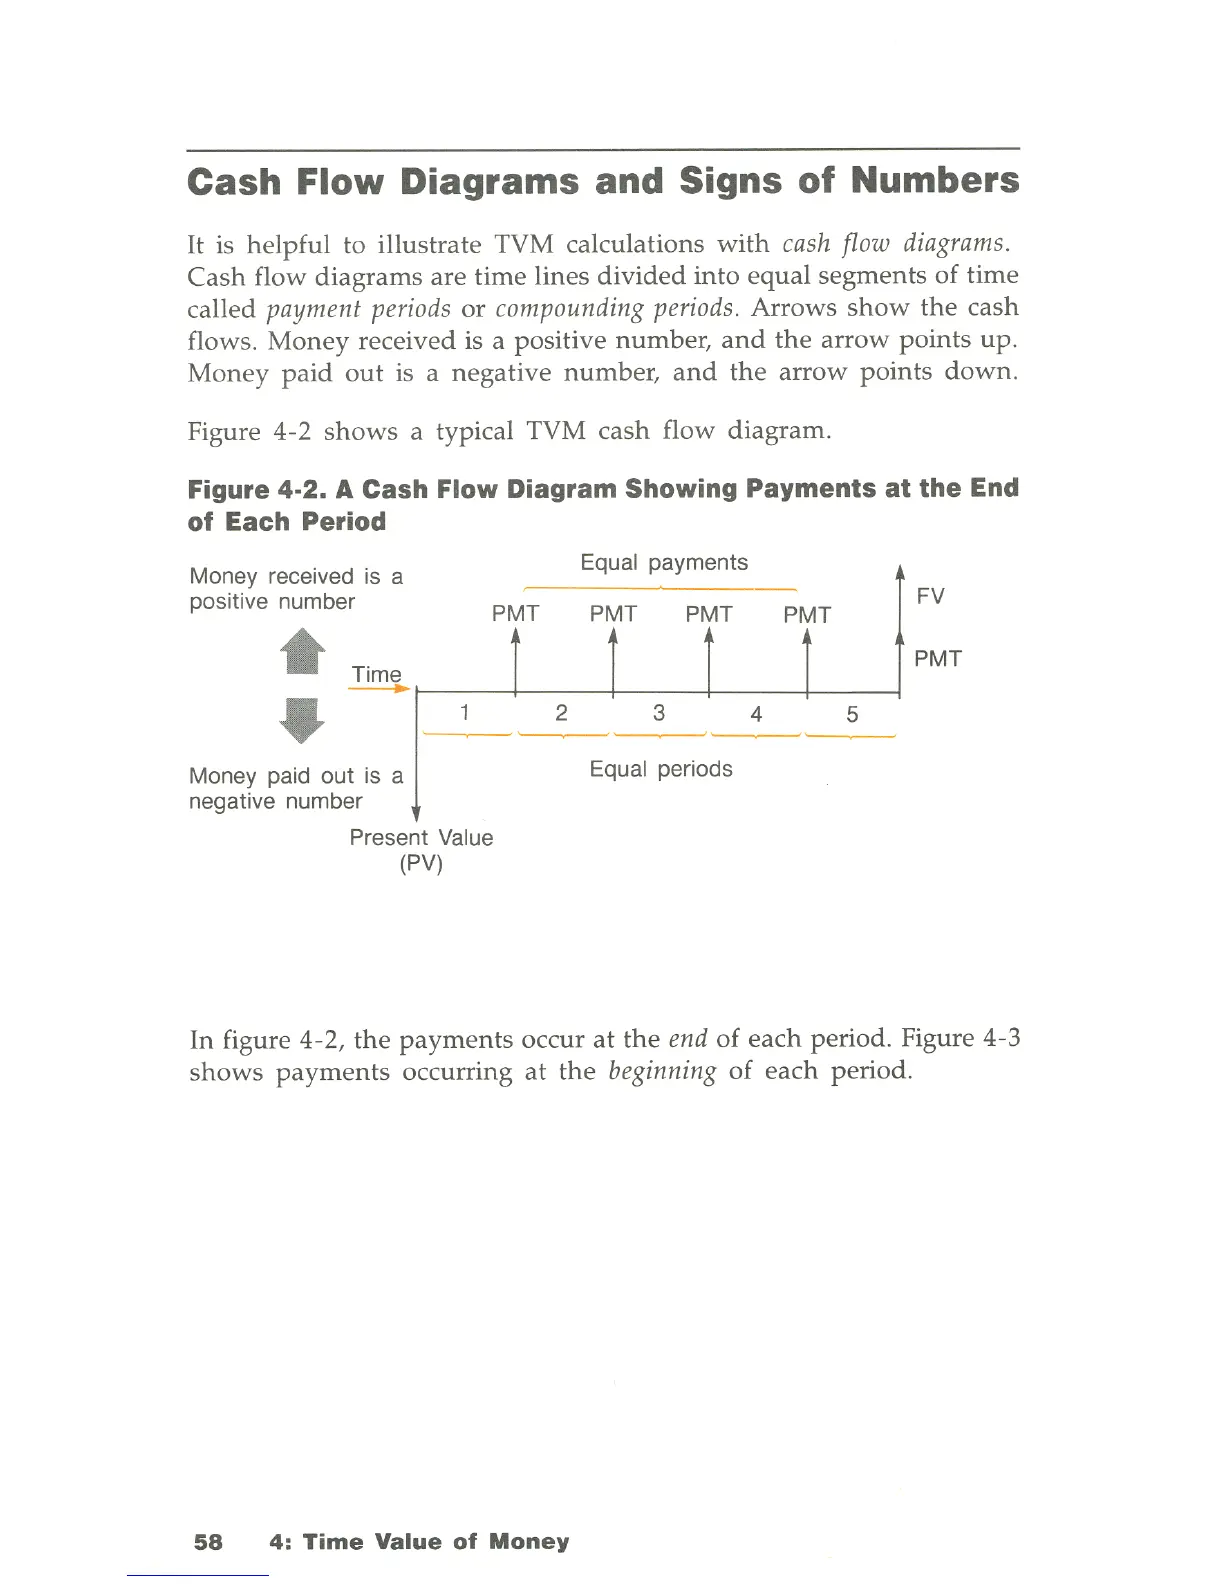
Figure 4-2
shows
a typical TVM
cash
flow
diagram
.
Figure
4·2.
A Cash Flow
Diagram
Showing
Payments
at
the
End
of
Each Period
Money received
is
a
positive number
PMT
Equal payments
PMT PMT
PMT
Time
---.
r-----4------+----~------+_--~
Money paid out
is
a
negative number
Present Value
(PV)
2
3
4
5
Equal periods
FV
PMT
In figure 4-2,
the
payments
occur
at
the
end
of
each
period. Figure 4-3
shows
payments
occurring
at
the
beginning
of
each
period.
58
4:
Time
Value
of
Money

Table of Contents

Related product manuals