LP-387 Rev. 011 Rel. 005 Date 1.3.19
18
The chart below represents various system design temperature rise through the boiler along with respective ows and friction loss. This is
provided to aid in circulator selection.
System Temperature Rise Chart
20°Δt 25°Δt 30°Δt
Model Friction Ft Flow Rate (GPM) Friction Ft Flow Rate (GPM) Friction Ft Flow Rate (GPM)
55 1.8’ 5.3 1.1’ 4.2 0.8’ 3.5
80 2.8’ 8.2 1.9’ 6.5 1.3’ 5.4
110 4.3’ 10.6 2.9’ 8.4 1.8’ 7
155 2.5’ 14.6 1.7’ 11.7 1.3’ 9.7
199 3.7’ 18.7 2.6’ 15 1.9’ 12.5
285 7’ 26.8 4.7’ 21.4 3.5’ 17.9
399 9.5’ 37.5 7.1’ 30 5.7’ 25
Table 6 - Temperature Rise, Friction Ft and Flow Rate
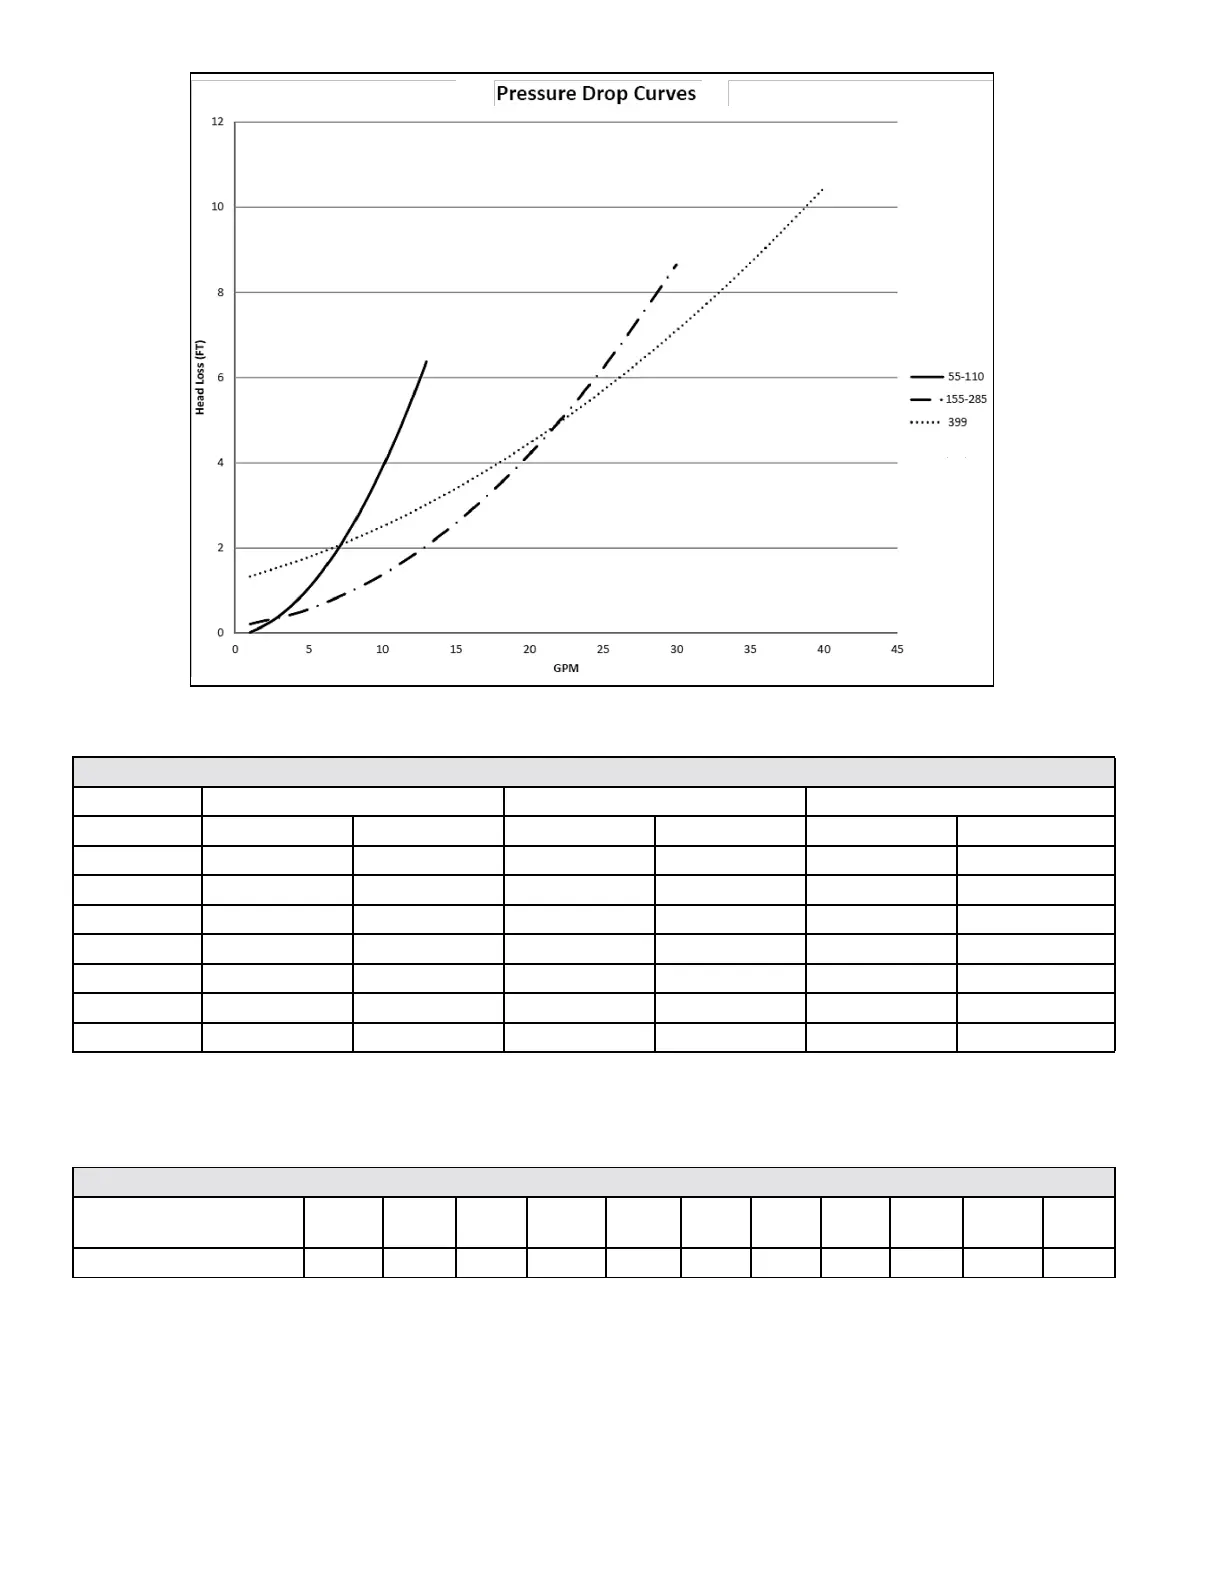
Figure 7 - Boiler Pressure Drop
The chart below represents the combined ow rates and pipe sizes when using multiple boilers to design the manifold system for the primary
circuit. To size, simply add up the number of boilers and the required ow rates for the system design temperature.
Example: (5) 55 Model boilers with a design of 20°Δt degree temperature rise with each boiler having an individual ow rate of 5.3 GPM. To
correctly size the manifold feeding these (5) boilers you would need a pipe size of 2”.
Multiple Boiler Manifold Piping
Maximum Flow Rate
(GPM at 3 Feet per Second)
8 14 19 31.5 45 69 93 120 150 188 271
Schedule 40 Pipe Dia. (In.) 1 1 1/4 1 1/2 2 2 1/2 3 3 1/2 4 4 1/2 5 6
Table 7 - Multiple Boiler Manifold Piping
 Loading...