158 IBM NeXtScale System Planning and Implementation Guide
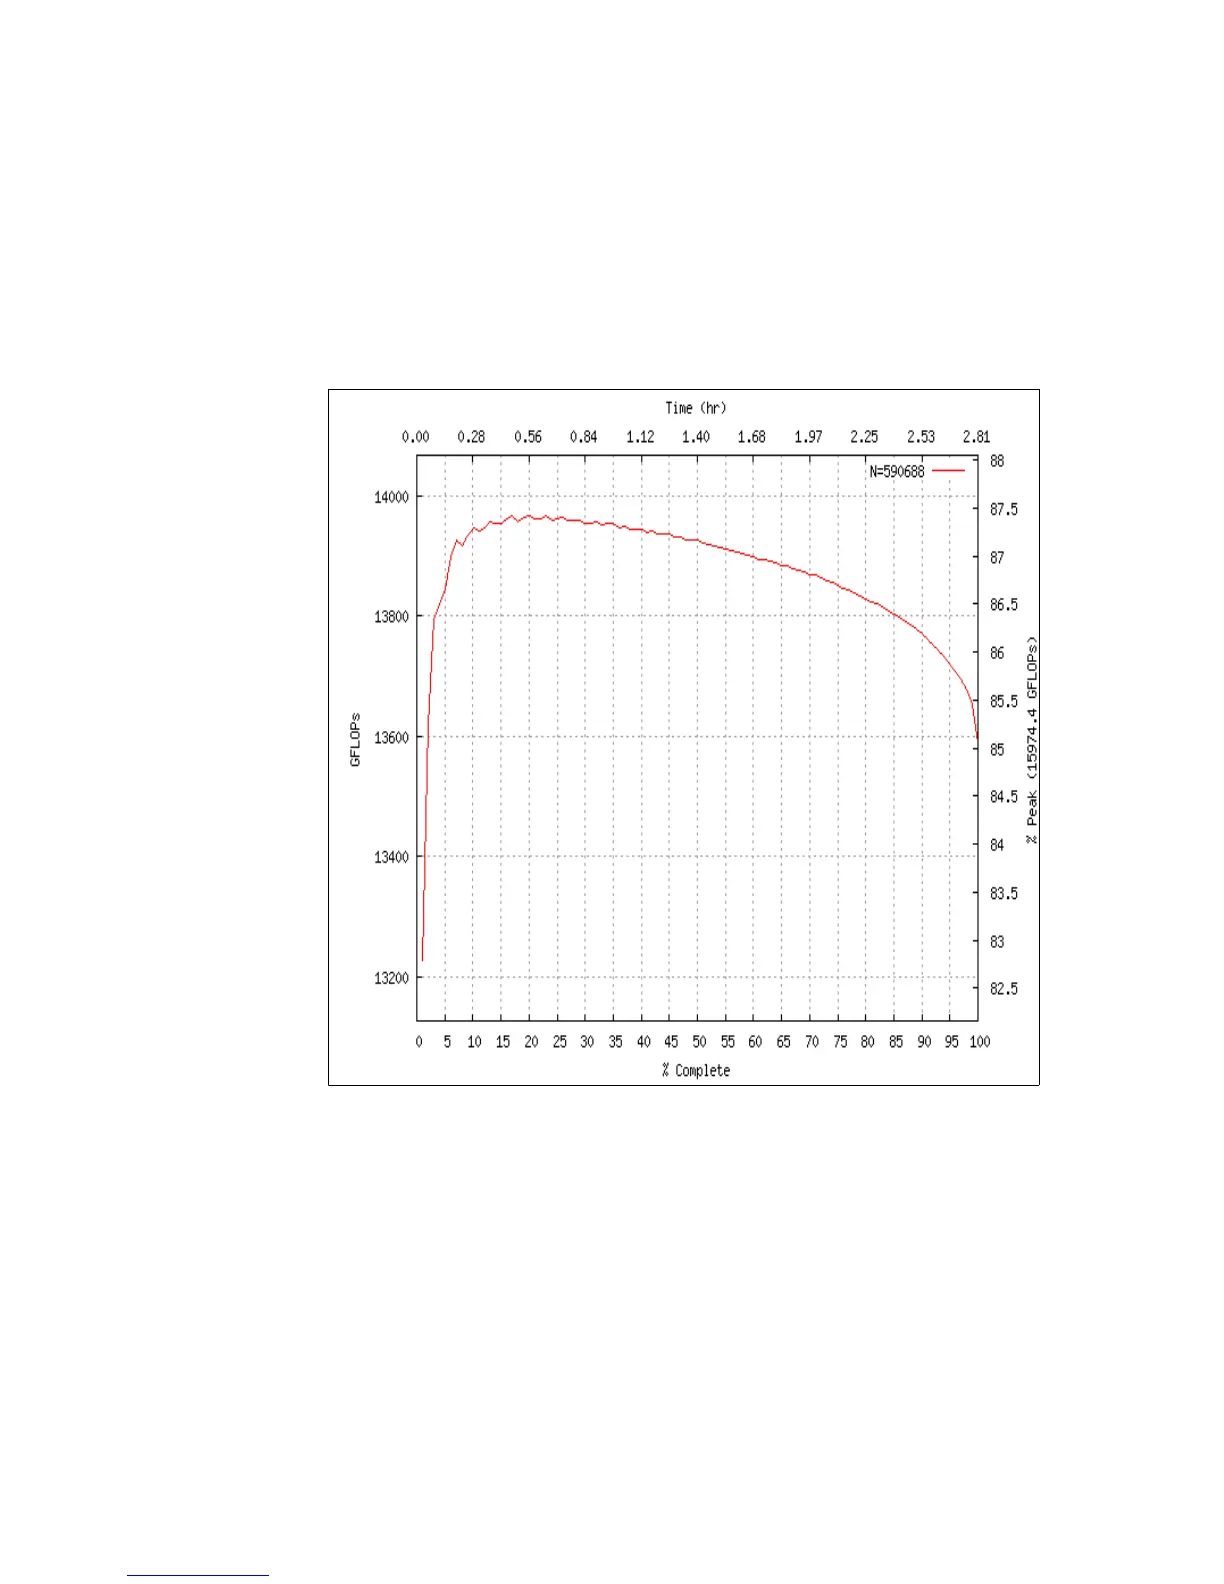
Output graph with the following axis, as shown in Figure 6-1:
– Left y-axis = Gflops
– Bottom x-axis = Percentage completed
– Top x-axis = Wall clock
– Right y-axis = Efficiency
Figure 6-1 Example of HPLinpack output graph
Although open systems can be racked, cabled, configured, and tested by users,
we encourage clients to evaluate the benefits of having IBM integrate and test
the system before delivery. We also suggest engaging the IBM Lab Services
cluster enablement team (CET) to speed the commissioning after the equipment
arrives.