17
5. Measurement
The instrument immediately starts measurement mode once it is booted, and you can see sound
pressure map on the screen if you face it towards to a measurement target.
5.1. Measurement screen (display sound pressure map)
(1) Displayed information
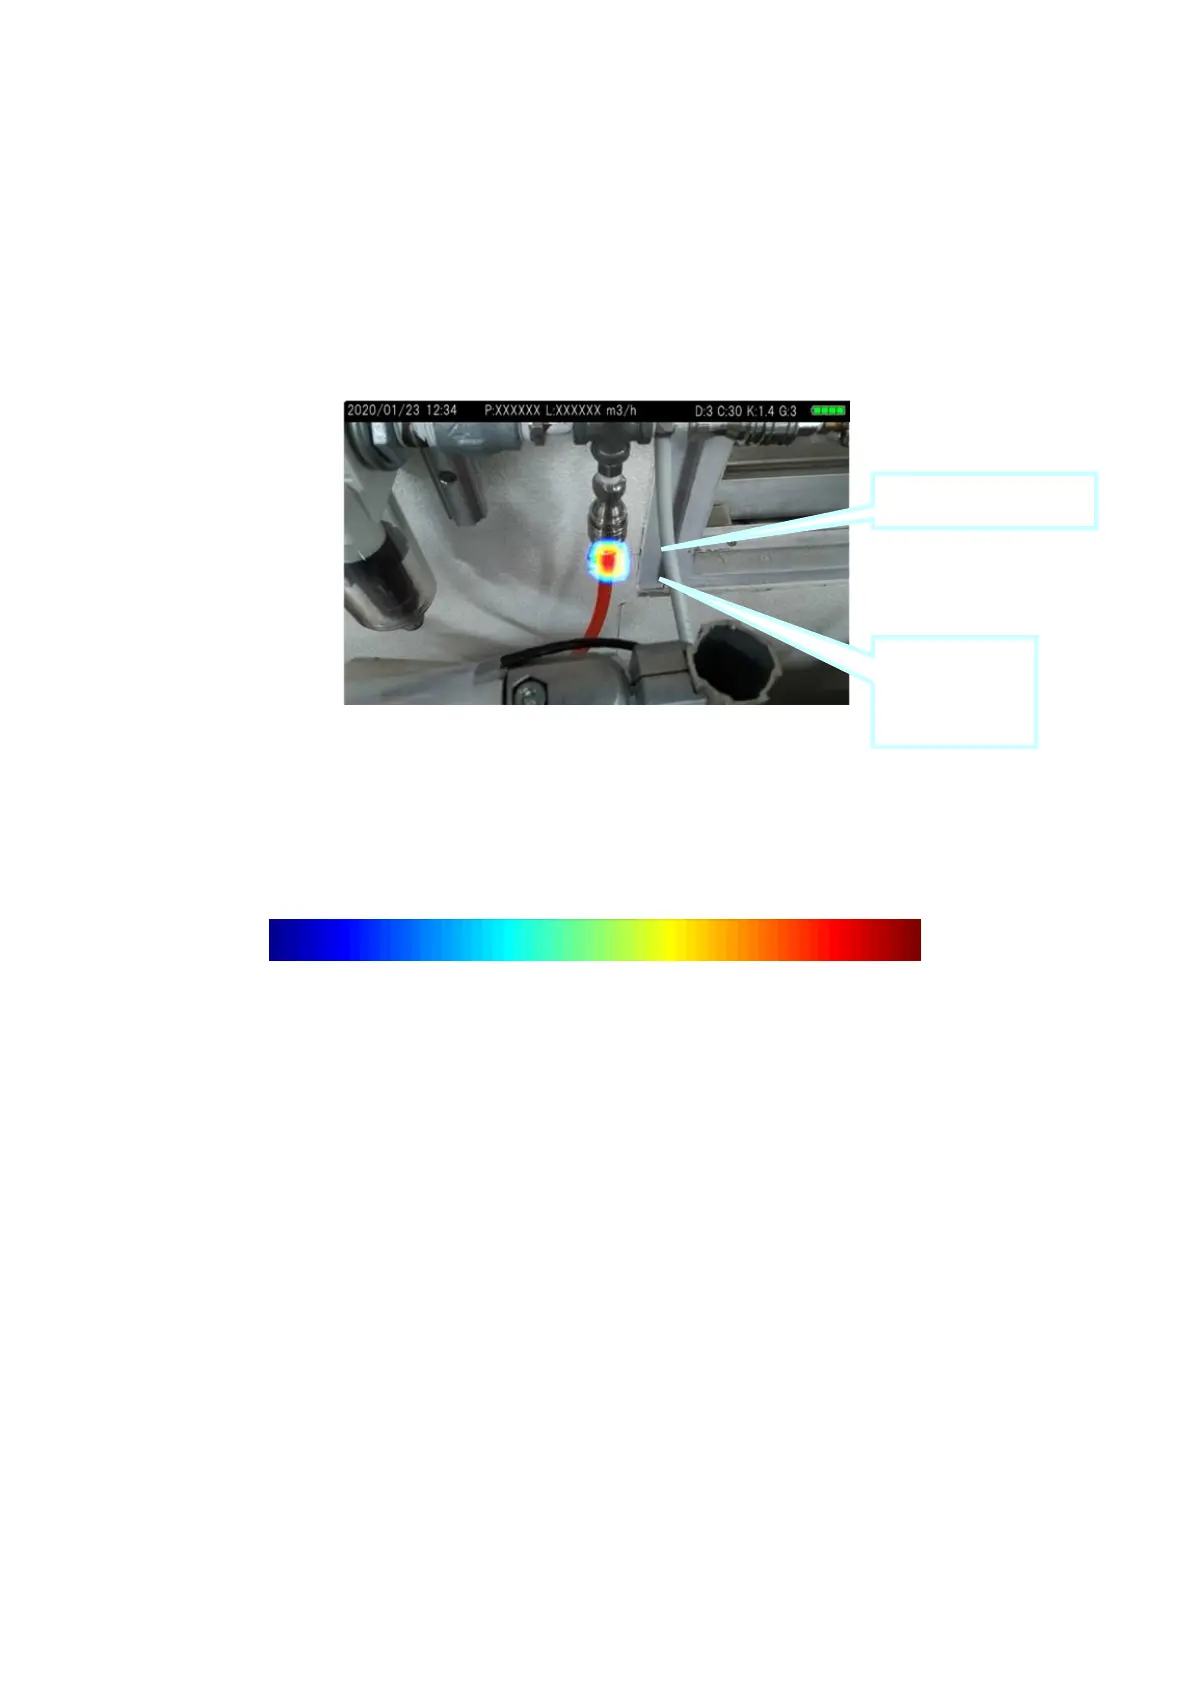
Sound pressure map represents loudness of sound in color based on the sound peak (max) value of
ultrasonic wave. Sound pressure peak point (=sound source (leak point)) is shown in red color.
Displaying colors in sound pressure map
Weak Strong