10 Start-up parameter (setup only)
92
After pressing the "Edit" button (or double clicking on the relevant line), the process value for the previ-
ously marked line can be selected:
10.2 Display
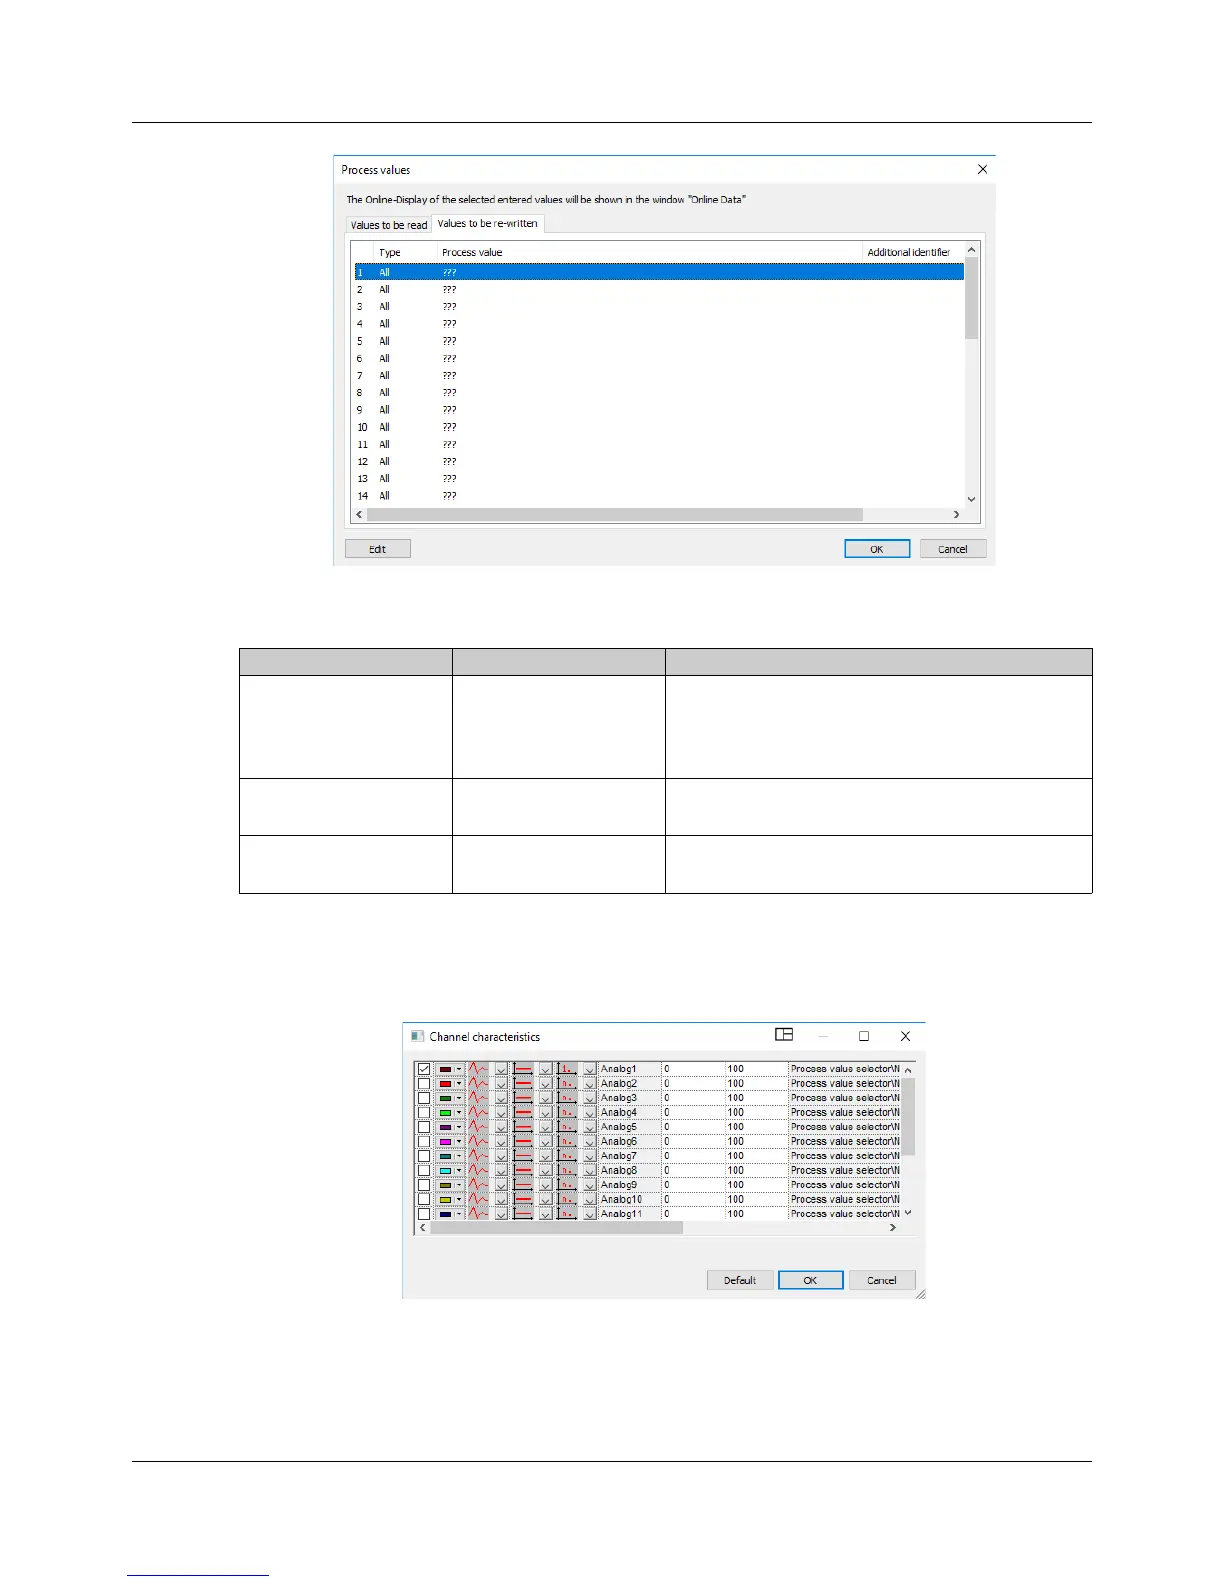
The channel properties (color, line type and width, type of y axis, scaling) for the visualization are spec-
ified in this window (open by double-clicking).
Up to 18 channels in a line chart (channels can be individually hidden) can be shown in the visualization.
The X axis depicts the time course of the signals in the diagram. The values of the signals are represent-
ed on the Y-axis, whereby only one signal can ever be selected for the main y axis. The values of the
other signals are represented either on additional Y axes (auxiliary y axis) or without a y axis.
A toolbar provides various functions for recording, displaying, and archiving process values.
Parameter Selection/text/value Description
Process value Select the process value
from the selector (drop-
down menu)
No selection
External analog input, external digital input, analog
flag, or digital flag
Additional identifier Enter text (max. 30 char-
acters)
Individual designation of the process value
The text is used in the online data window.
Unit Enter text (max. 6 char-
acters)
Process value unit
The text is used in the online data window.
 Loading...