As is shown in the figure above, the mouse lies above a positive pulse of the topmost channel,
an arrow will appear above this pulse and the negative pulse next to it. The measurement window
will show the following information: the width of this positive pulse is 20.125us; the period is
47.25us; the duty cycle of this period is 42.5926%; the frequency of this period is 21.16K.
Add timing makers: if you click the T1 or T2 in the measurement window with the left button,
and move the mouse to the waveform window, the green timing marker line would move with the
mouse. And if you press the left button again , this timing marker will stay where you press the
button. Click T1 and T2 in the measurement window, the corresponding timing marker would
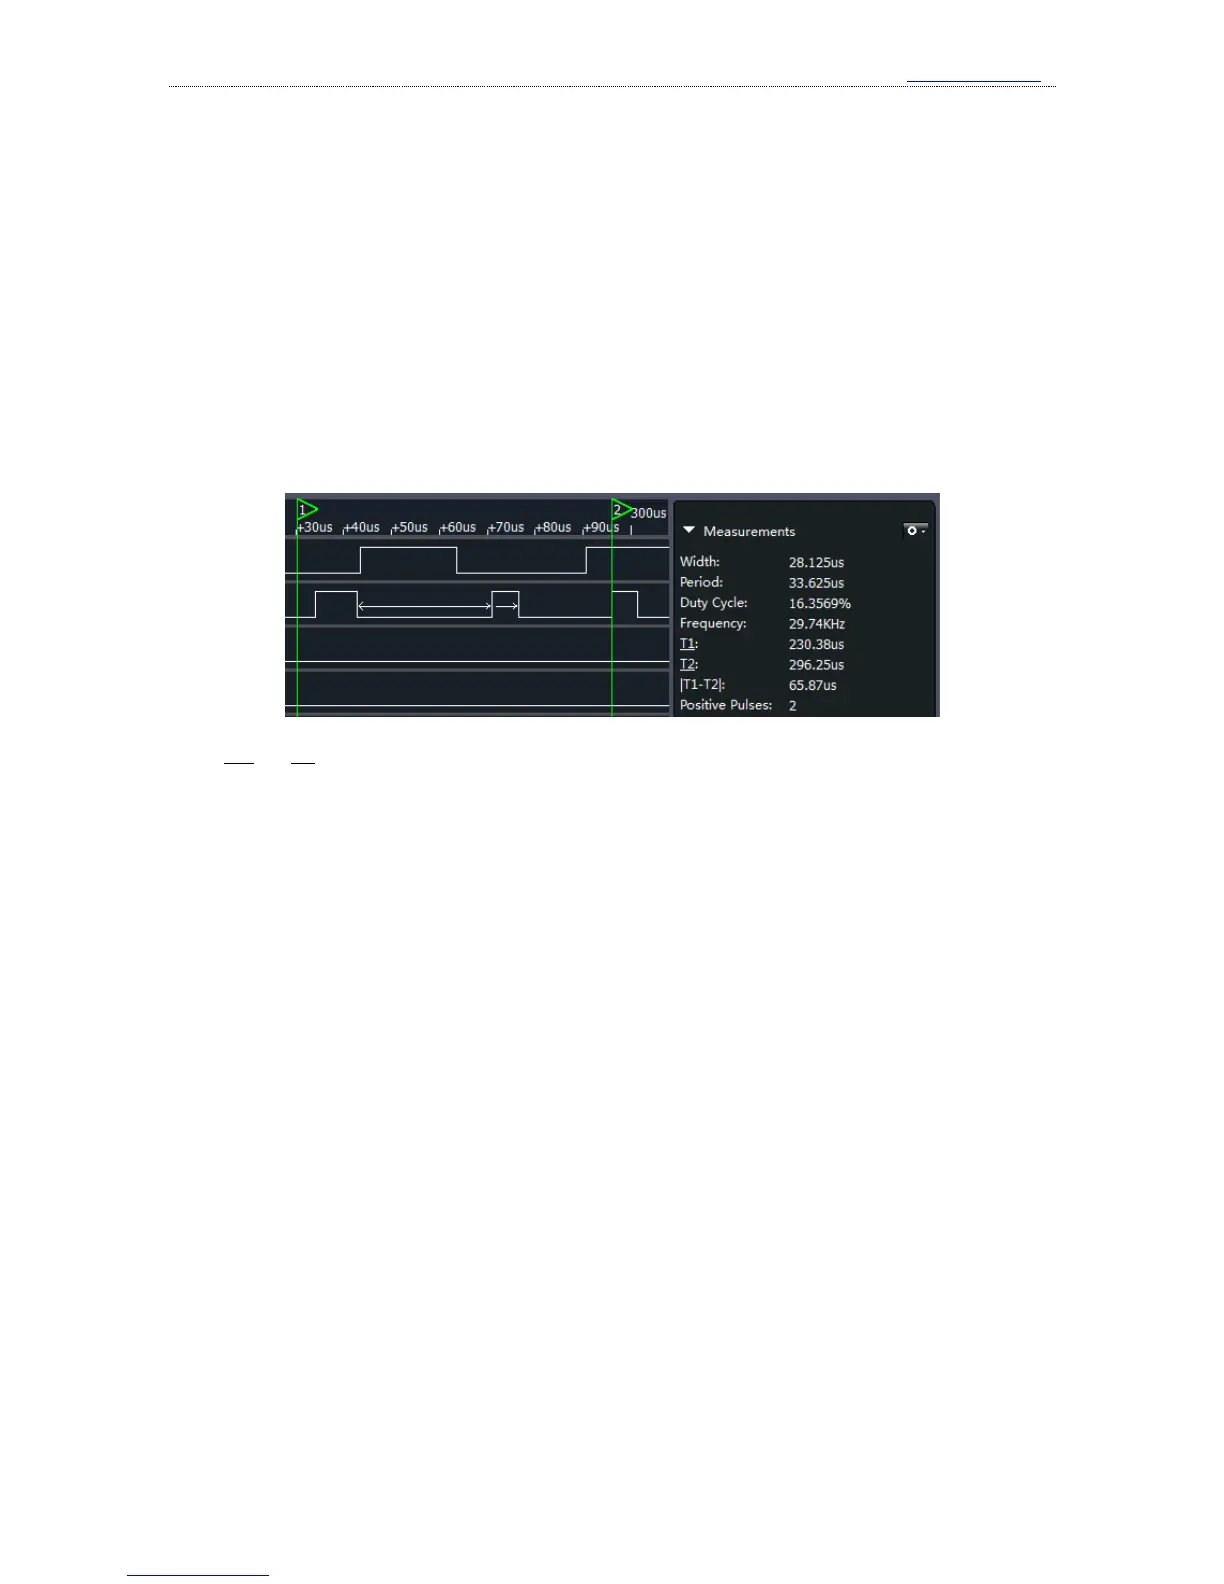
disappear. When both T1 and T2 exist, as is shown below, the items related to timing marker would
show the results.
T1 and T2 represent the time where T1 and T2 stay. |T1-T2| is the time difference of these two
timing markers, and the positive pulse shows the number of positive pulse between T1 and T2.
6、 Analyzers
If the signal to test conforms to standard protocols like UART, I2C, SPI which are supported
by Kingst VIS software(the complete protocol list is in section “Product technical specification”),
besides displaying the waveform and some measurement data, the software could analyze the data
to get the specific data according to protocol specifications.
Press the “+” button which is right side of the analyzer settings bar, and the analyzers that are
recently and most frequently used will be listed. As is shown in the figure below, if you press the
“Show more analyzers”, you will see other analyzers supported.