file types could be opened and edited with other software, for example, Excel could be used to
locate the data, and Matlab could load bin files to analyze further. The data of Kingst VIS will be
saved as kdat file, and could be opened using Kingst VIS software.
You can divide all the sample data to different kdat files with T1 and T2. In this way, the
invalid data would be filtered, to make the analysis and saving of the data easier.
②.Export analyzed data
If a analyzer has been added, and some data has been successfully analyzed, you could export
and save the analyzed data of this analyzer.
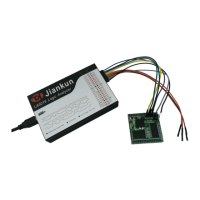
On the right side of the
analyzer, you could see a
settings button, and if you press
it and select “Export” in the
popped menu, the analyzed data
could be exported as txt or csv file, which could be opened with notepad or Excel for checking and
analyzing.
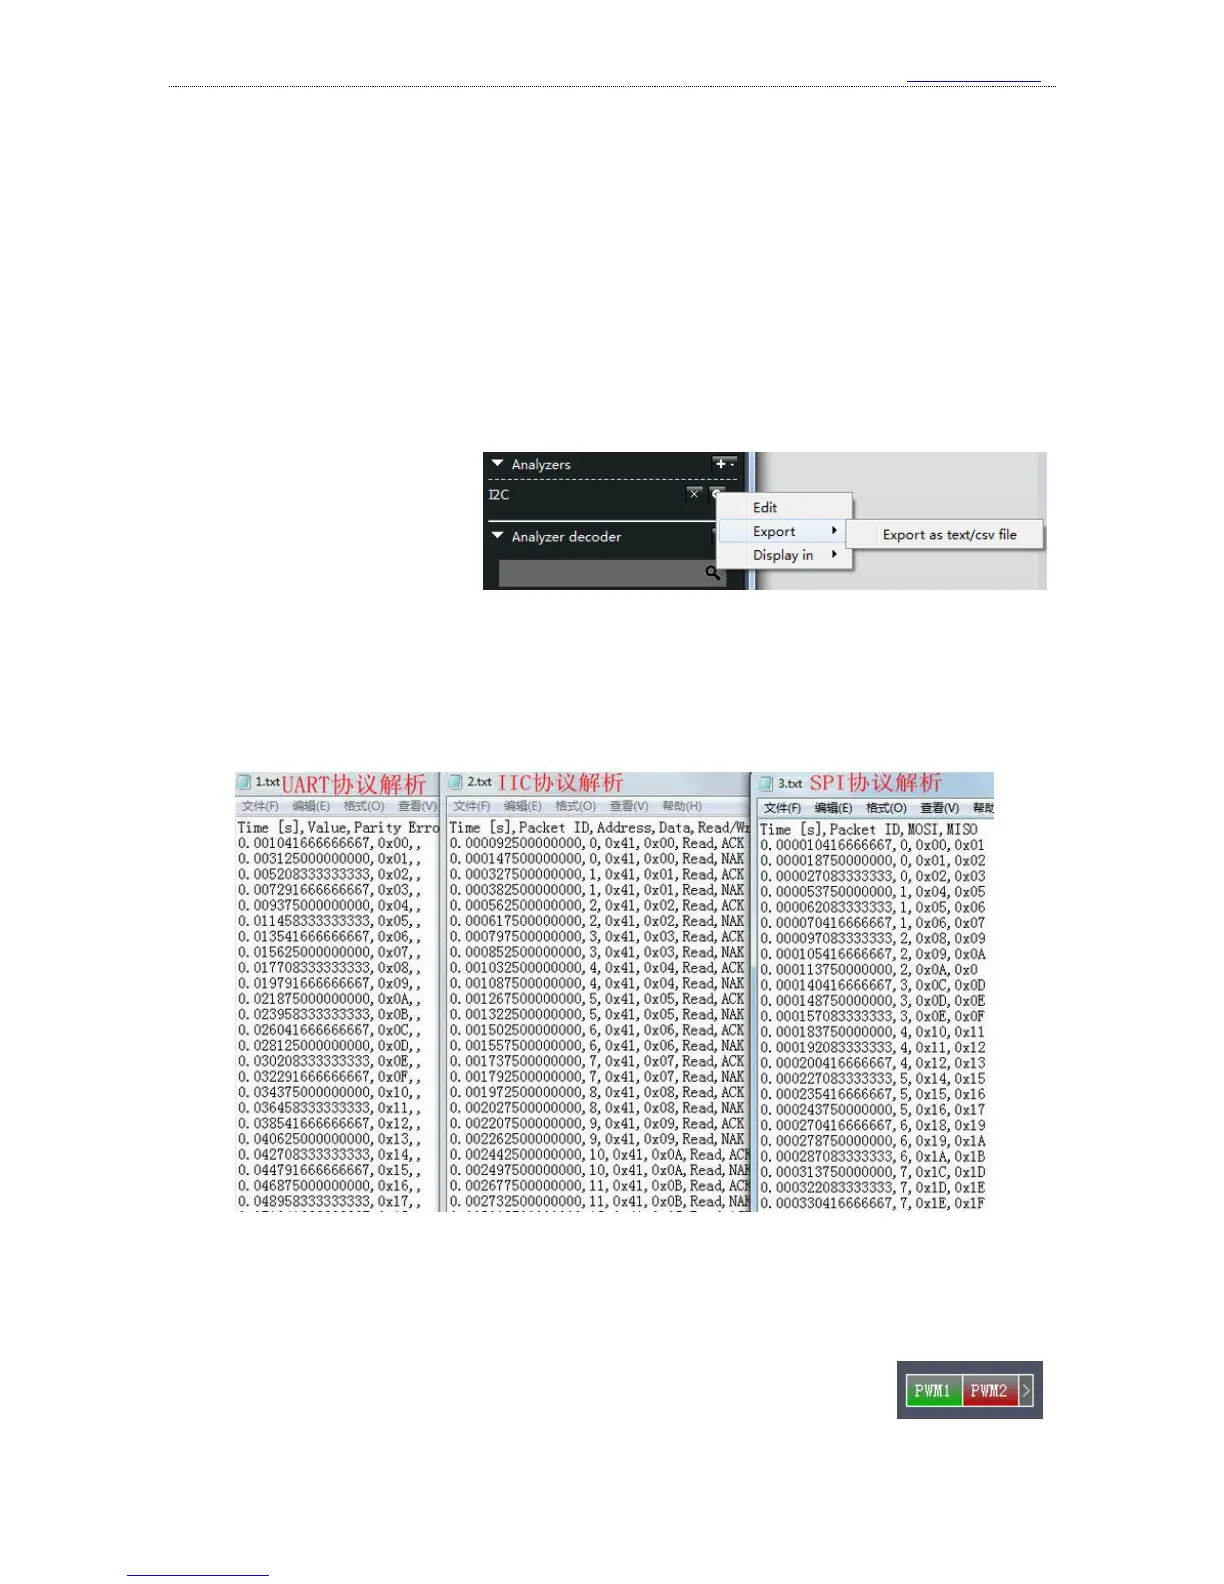
The figure below shows what is the analyzed data is like for UART, I2C and SPI. And in this
file, we could find time coordinate, packet sequence number and analyzed data.
10、 PWM generator
There are two PWM waveform generators in the logic analyzer except LA1002, and they can
generate square wave whose duty cycle could be adjusted.
When the device which support PWM export is connected to the software,
the PWM export control button is on the toolbar which is top of GUI. A green
button means this channel has been enabled and red button represents disabled state. By default,
 Loading...