As shown in the figure above, the software interface could be divided in several parts:
①. Tools bar:top of GUI, including common settings of the current device and the main menu
button of the top right corner.
②. Device and channel settings: left side of GUI, shows selected or connected device type,
and next is the number and name of current measurement channels.
③. Waveform display window: middle of GUI, the topmost is the timeline. The sampled
waveform displays in the middle and a scroll bar is below it.
④. Sampling result analysis window: right side of GUI, the top half shows measurement
results that are frequently used, and you can add analyzer decoder and see the results on the
bottom half.
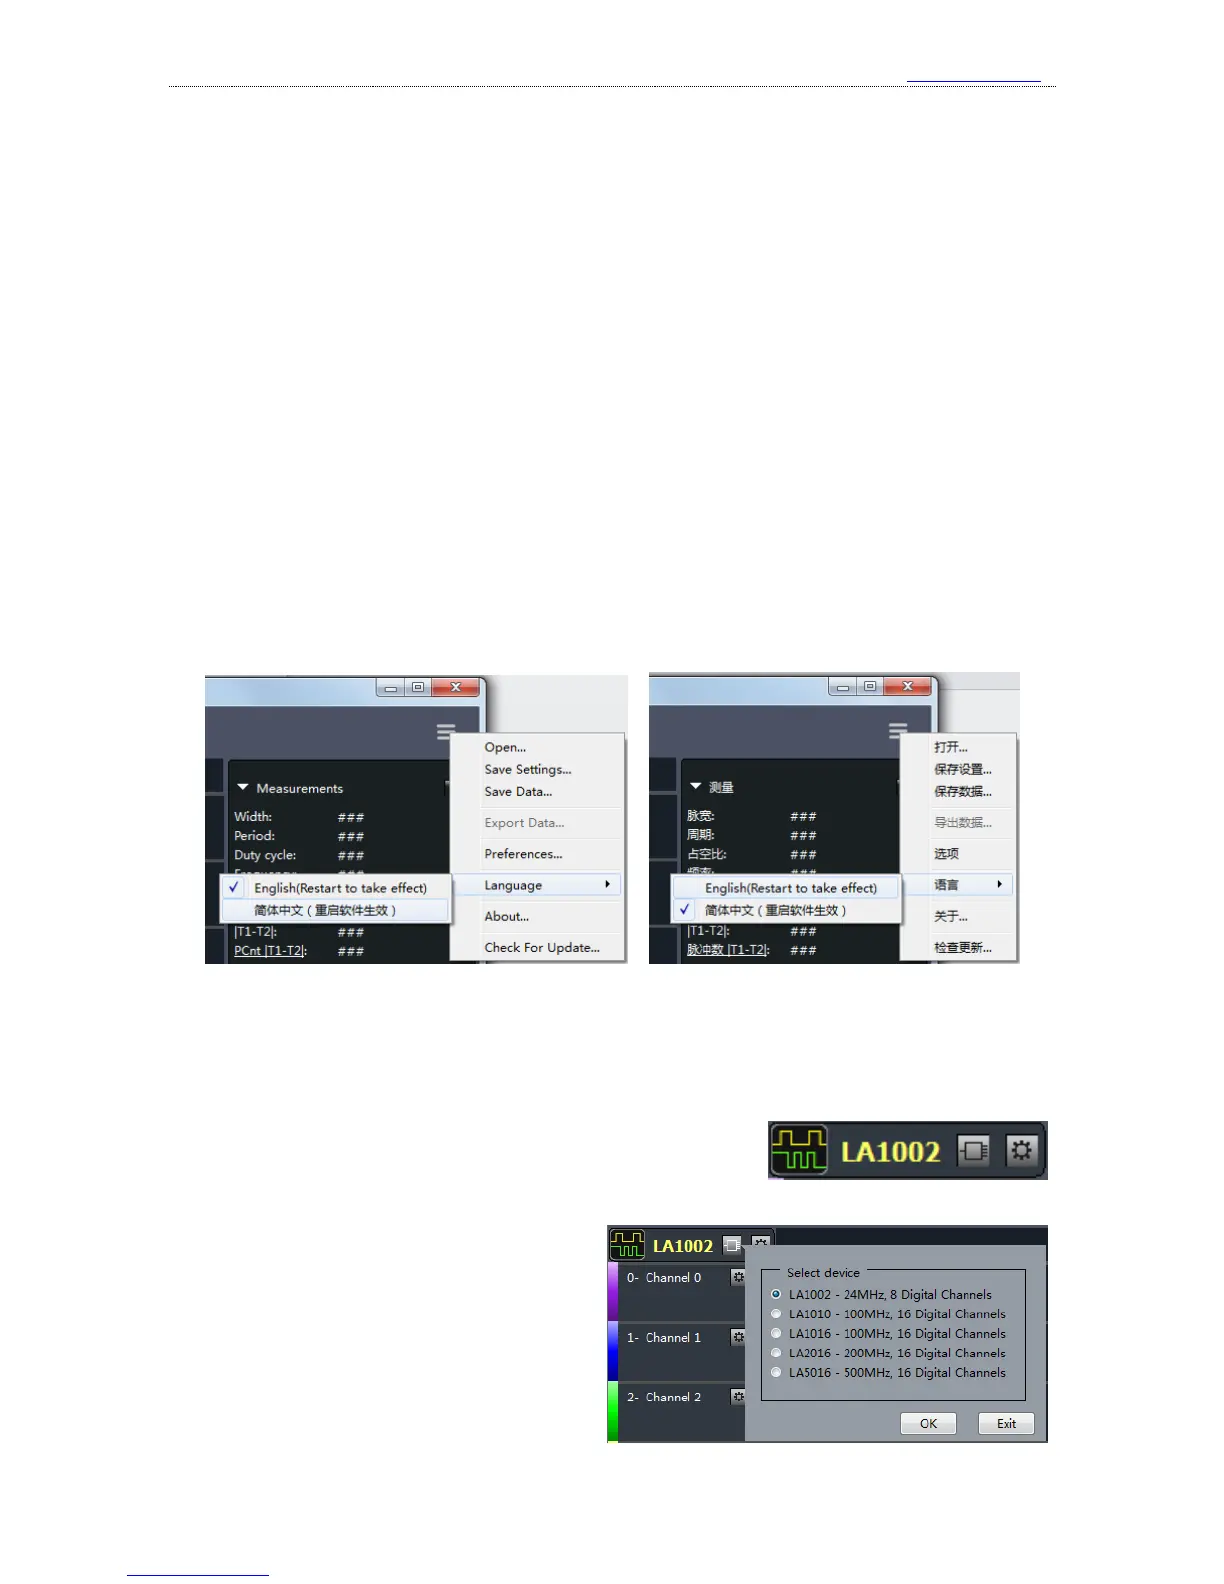
3、 Language switch
The Kingst VIS software could display in “English/简体中文”. If you want to change the
language, please press the “Options” button in the top right corner, move the mouse to the menu
item “Language”, and select the language. The selection would become effective after the software
is restarted.
4、 Brief introduction to the demo function
The software could provide demo function. You can simulate the functions without the actual
hardware, and you could get a good experience of the software through this function.
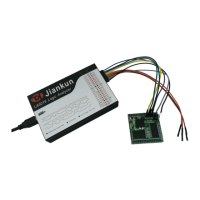
All Kingst virtual instruments share the same Kingst VIS
software. As shown in the right figure, there is a device control
bar on the left side of the software. The icon of left side represents that logic analyzer is the current
device, and the text in the middle means the
selected device is LA1002. If you press the
first button on the right side, as the right figure
shows, you could see all the devices supported.
You could select any device that you want.
After you press “OK”, you could evaluate and