10: Maintenance and Diagnostics Settings
EDS Device Servers User Guide 121
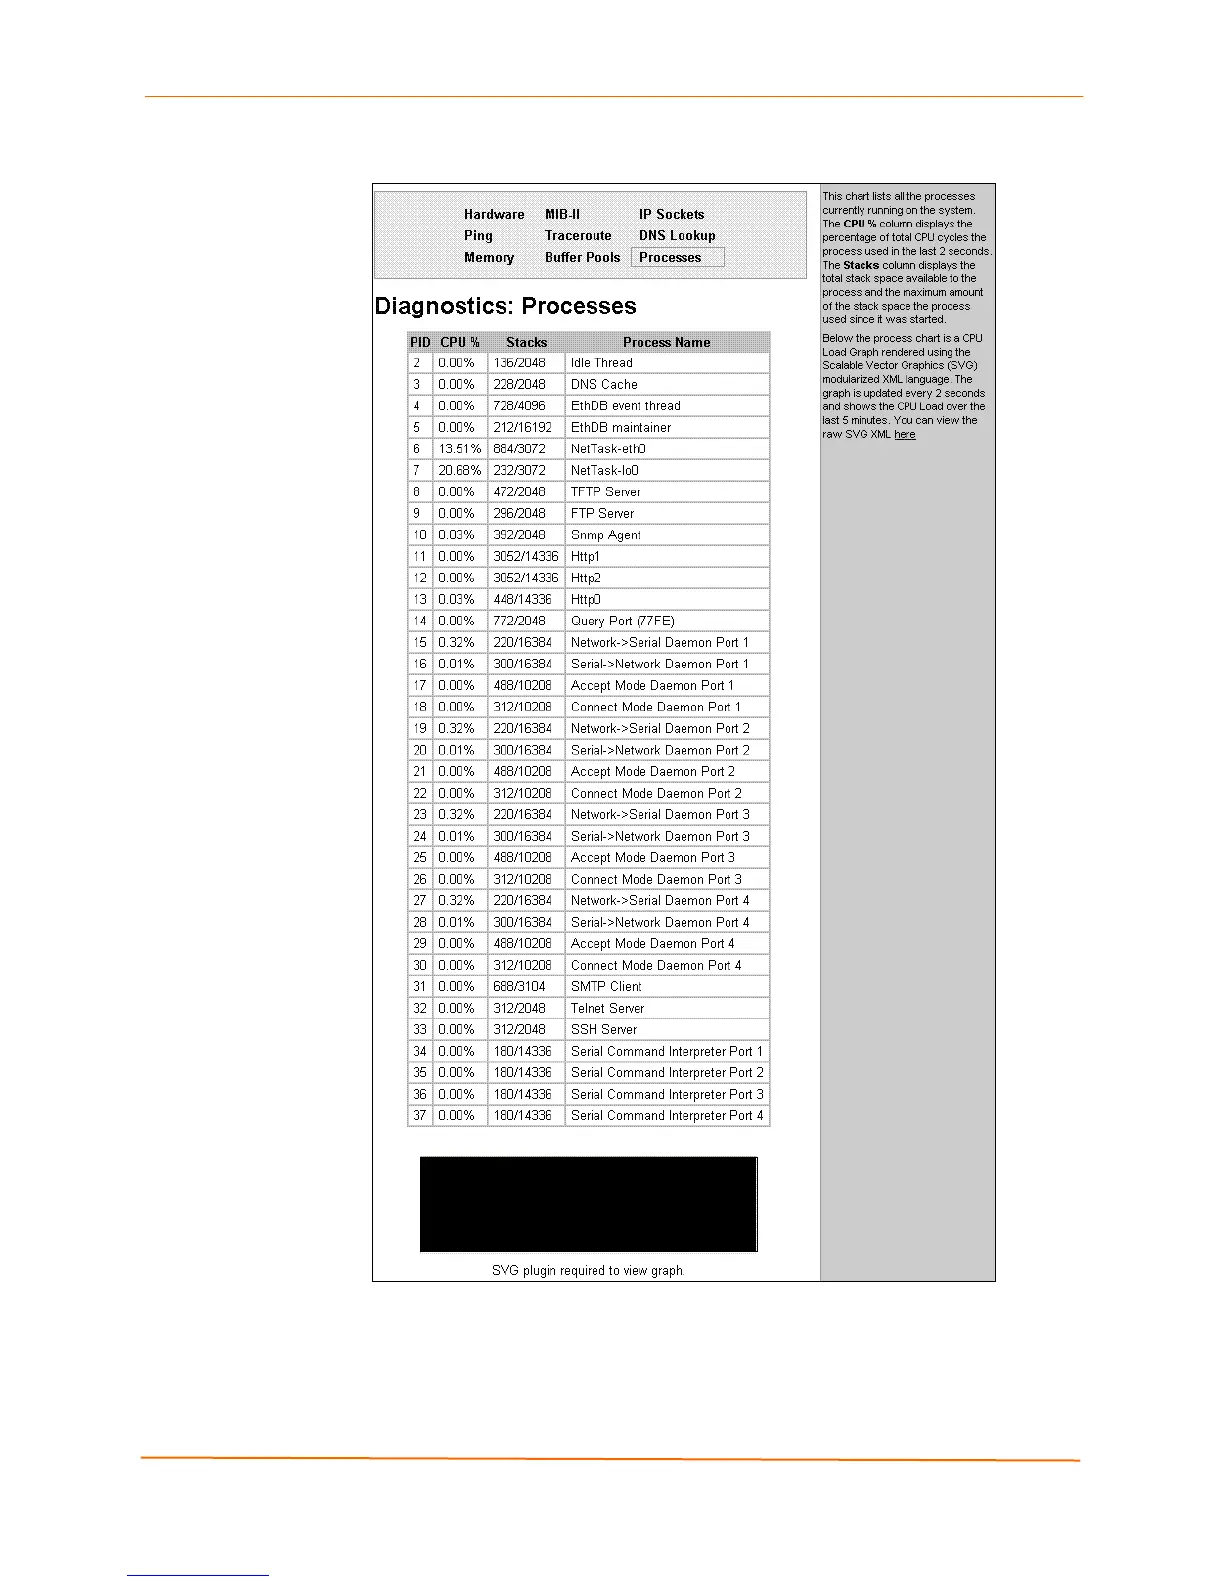
Figure 10-14. Diagnostics: Processes Page
Below the process chart is a CPU Load Graph that shows the CPU load over the last five
minutes. The EDS generates the graph using the Scalable Vector Graphics (SVG)
modularized XML language and updates every two seconds. The information area
contains a link for viewing the raw SVG XML.
Note: The SVG plug-in is available on the Internet.

 Loading...