Status
E220 Series Cellular Router User Guide 43
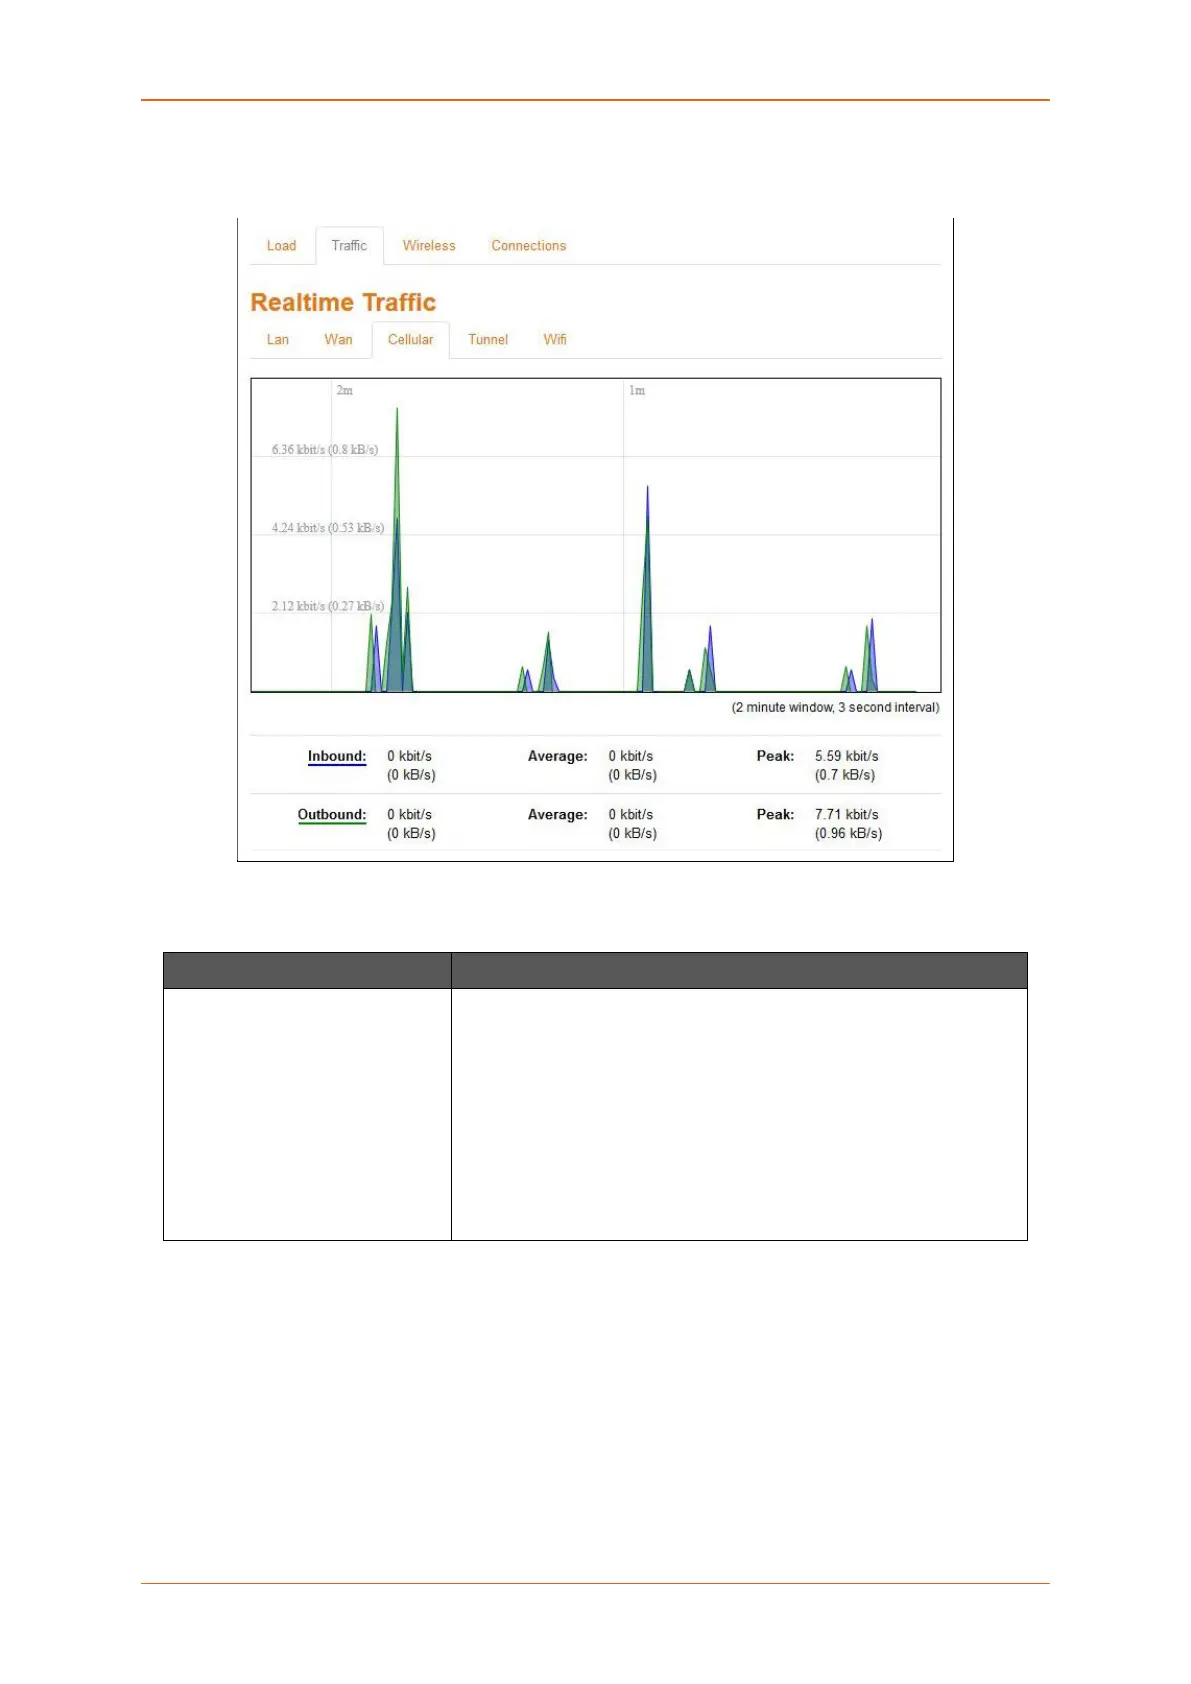
C. Cellular
Graph shows past two minutes average Cellular traffic and peak Cellular traffic on the router.
Screen 8-7: Real Time Cellular Traffic Graph
Parameters Description
Traffic (Inbound / Outbound) Graph shows the periodic average Cellular Traffic on the Router.
Details
• X axis – Time Interval (1 minute)
• Y axis – Tunnel Traffic (kB/s)
Legends
• Blue – Inbound Traffic
• Green – Outbound Traffic
Table 8.5-5: Real Time Cellular Traffic Graph
 Loading...