HVM200 Reference Manual Making the Measurement 3-8
• X-axis
• Y-axis
• Z-axis
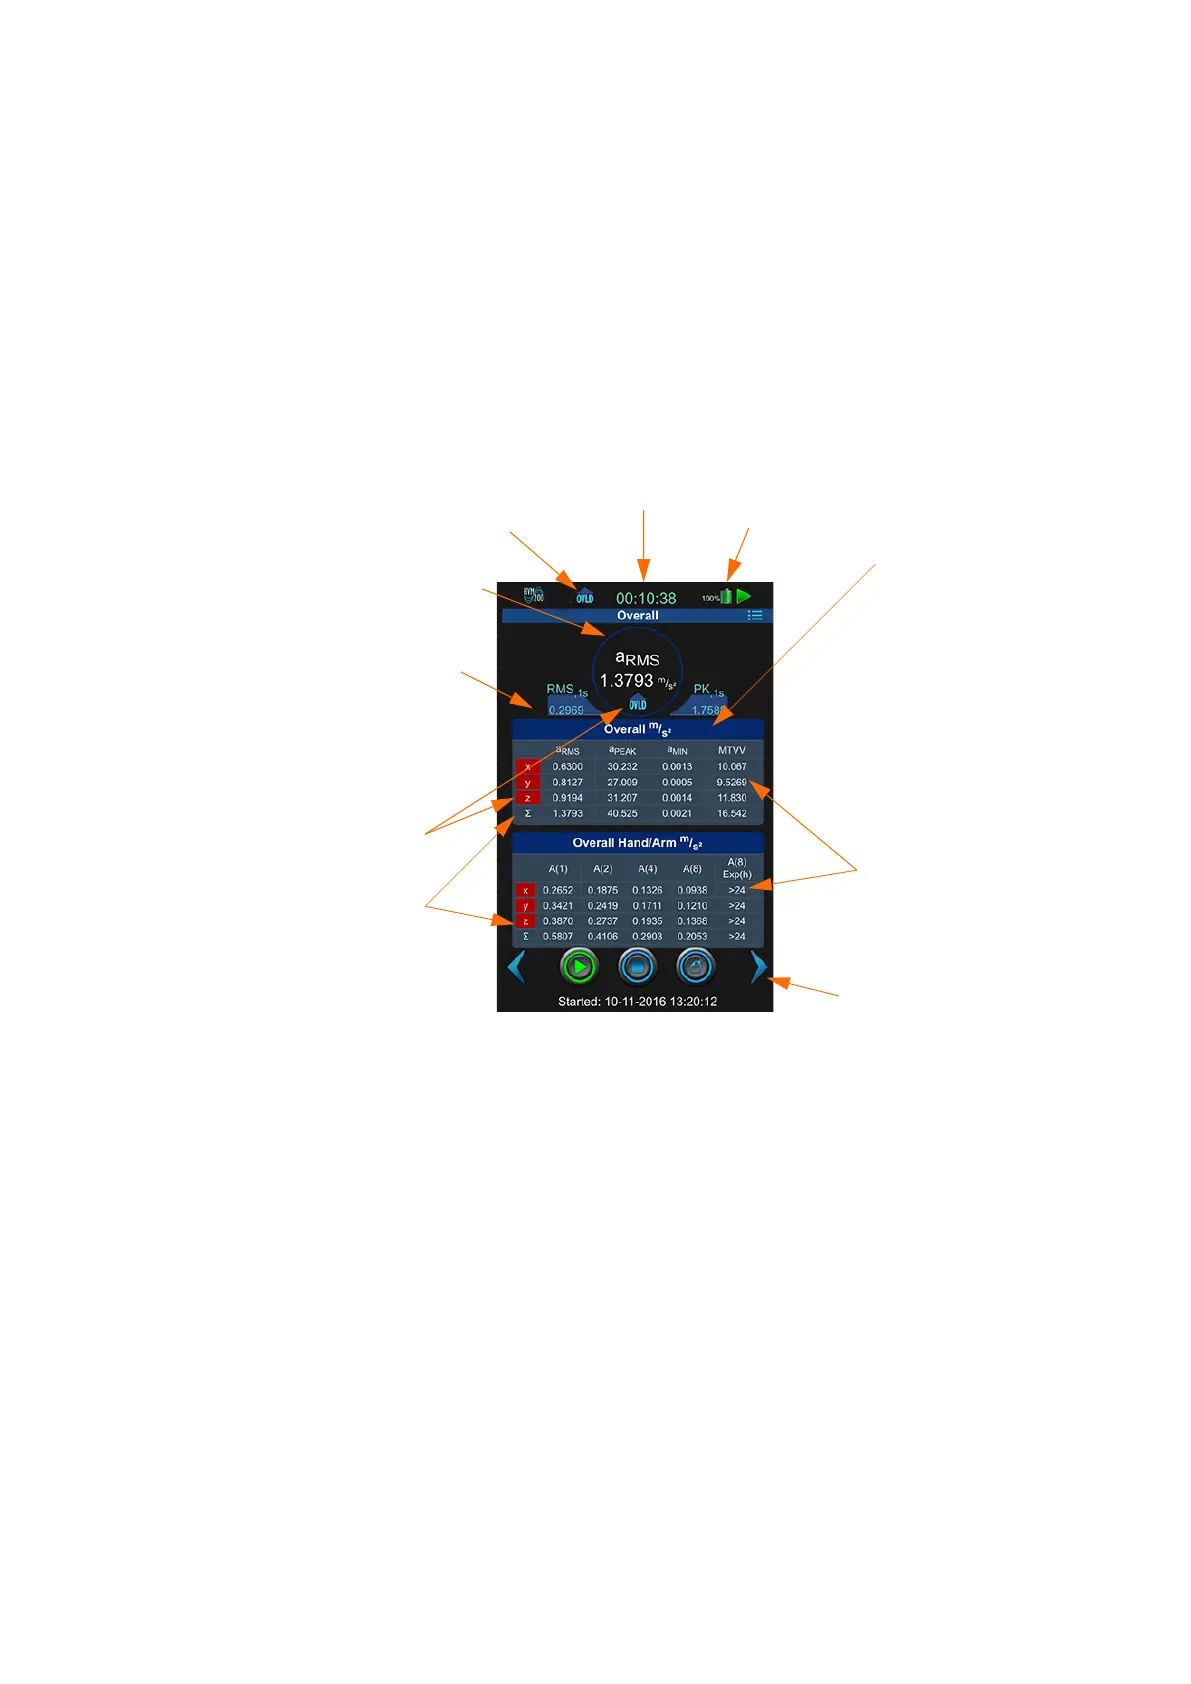
To advance from one data display to the next, click the Next Arrow. To
enlarge a data display, click the Zoom button.
The Overall display shows cumulative data for all 3 axes and their
summation for the measurement.
FIGURE 3-5
Overall Data Display
MIN and MTVV are the minimum and maximum whole body and hand/
arm values of the vibration signal with a 1 second exponential time
weighting. MIN and MAX are the minimum and maximum general
vibration values.
represents the summation of vibration values taken from the X, Y, and
Z axes.
The Summation display provides a real-time graphical representation
of the current summed values from all three axes.
Current overall root mean square
(RMS) vibration value according to
specified units.
Measurement
Duration Clock
RMS value from the previous
second
Overloaded Indicators
Values for each axis
Summation values
Next data display
arrow
Battery
Status
RMS: Root mean
square value
PEAK (PK): Highest
instantaneous value
MIN: Lowest value
MTVV: Maximum
Transient Vibration
Value
Overload Indicator
 Loading...