HVM200 Reference Manual Making the Measurement 3-9
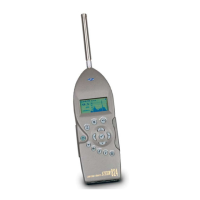
FIGURE 3-6 Summation Data Display
For more information on summation values, including Vibration Dose
Value (VDV) and the daily vibration exposure value over 8 hours A(8),
see the “Glossary of Terms” on page C-1.
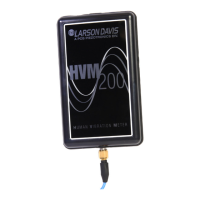
The Axes displays provide real-time graphical and tabular
representations of current and overall values for each axis.
FIGURE 3-7
X, Y, and Z Axes Data Displays
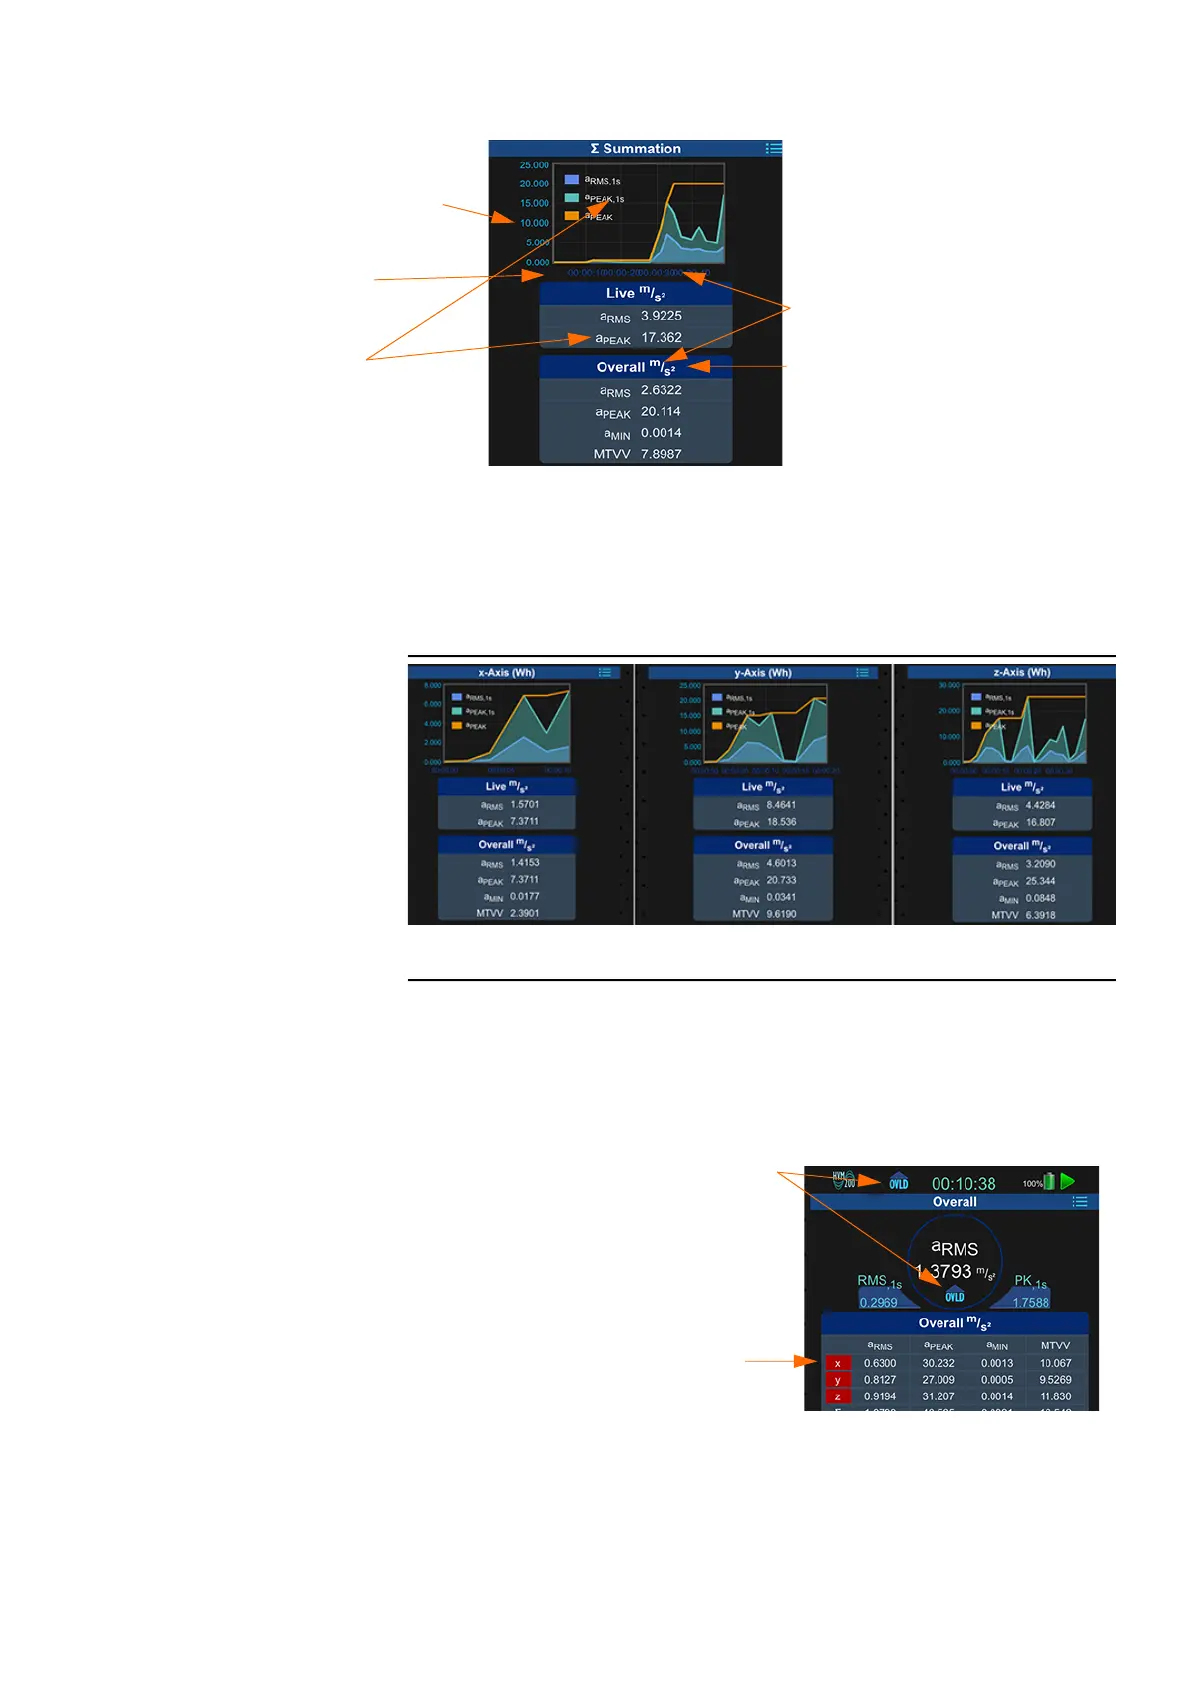
Overload Indicator
LEARN MORE For information on
overload indications on the Status
LED,
see “Operational
Characteristics” on page A-2
.
An overload occurs when the signal from the accelerometer exceeds
the input range of the meter.
FIGURE 3-8
Overload Indicators
Under-range Indicator
An under-range condition occurs when the signal from the
accelerometer is below the input range to the point it cannot be
measured accurately.
Vibration values according to
specified units
Measurement Time
Current a
PEAK
value
Overall measurement data
X
Y
Z
Indicates an overload has
occurred on one or more
axes in the current
measurement
Red background shows the
overload for each axis.
 Loading...