Proline Low-temperature Thermostats
72 Starting up YACE0072 / 21.08.07
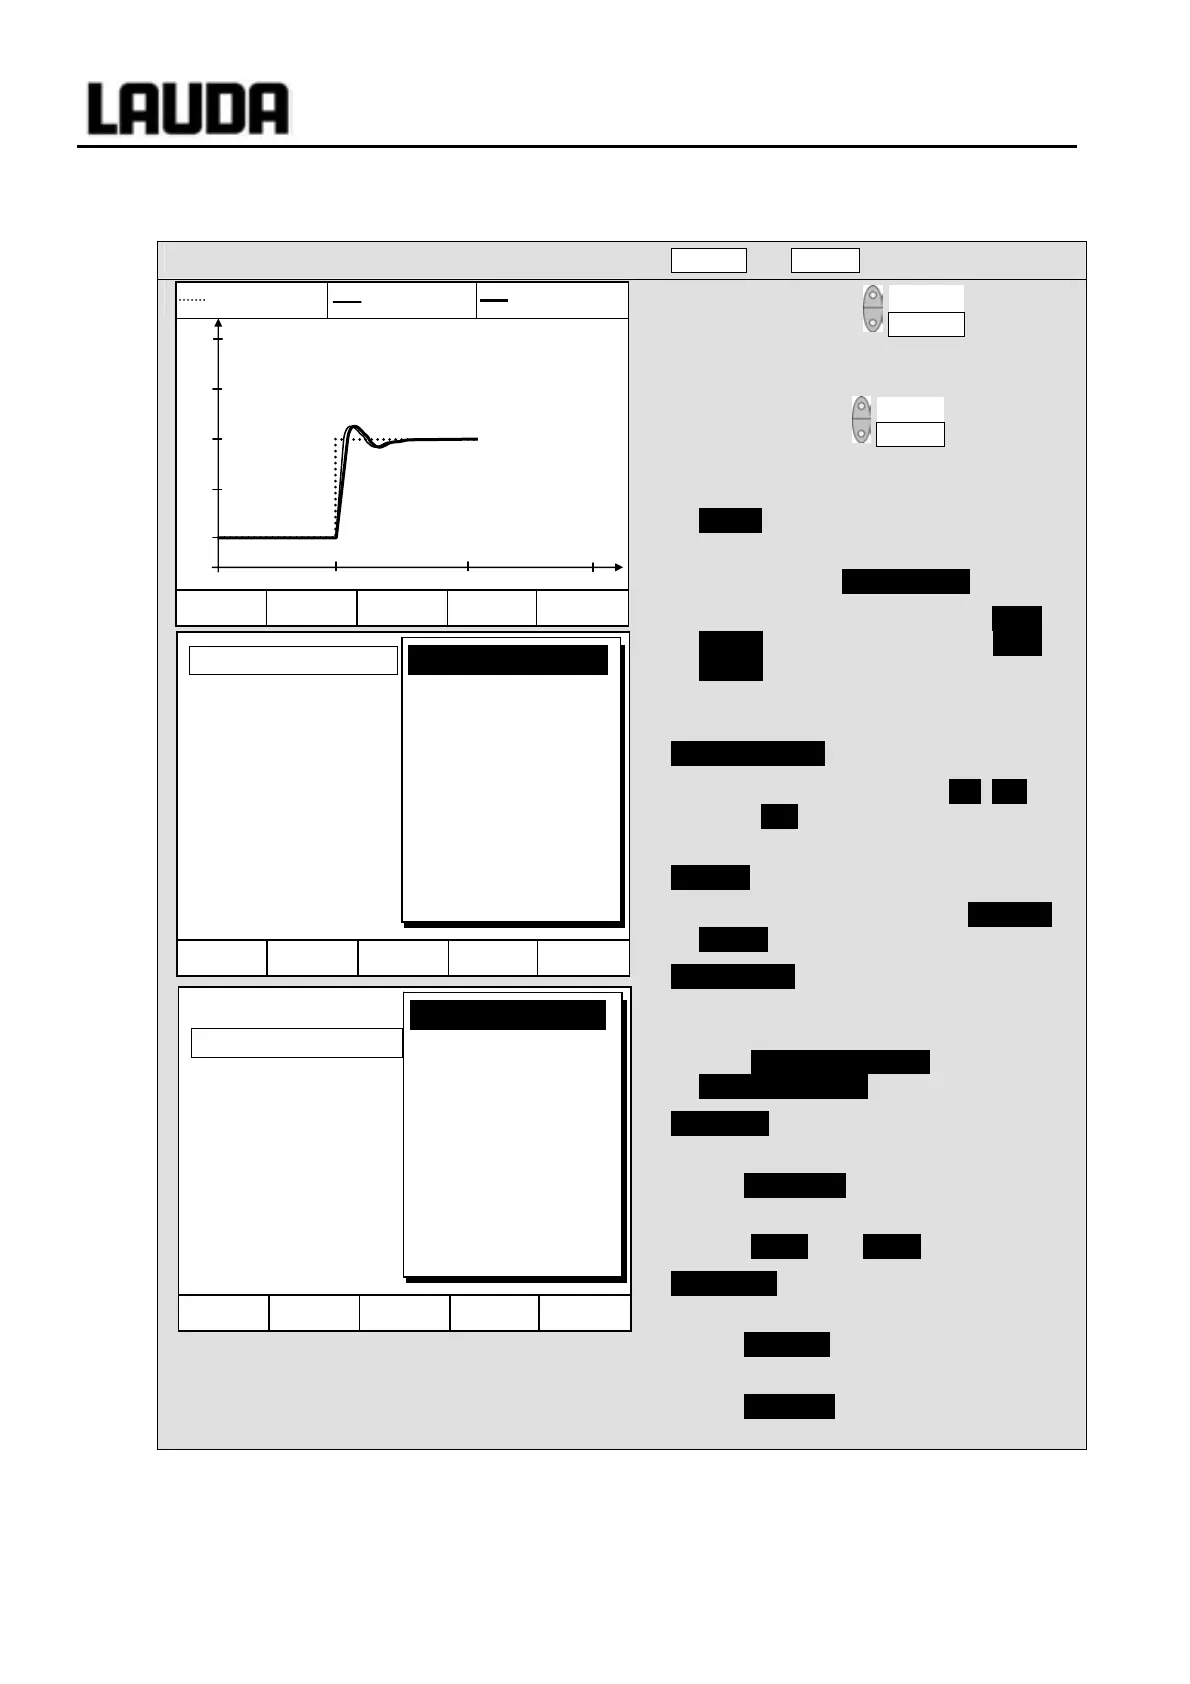
7.9 Graphical display of temperature measurements (Command)
Command
Screen and Graph
− Press the soft key Screen a number of
times as required until the graph recorder
window appears.
− With the soft key Graph you enter the
menu for the configuration of the graph
recorder.
− Mode defines,
− whether the recording is to run
continuously as Online graph ,
− or whether it is to be started with Start
record and later terminated with Stop
record . When this start/stop mode is
active, Rec flashes at the top left of the
display.
Displayed value defines,
− which of the measurements T
int
, T
set
and/or T
ext
is to be graphically displayed.
In the menu all combinations are offered.
Legend defines,
− whether the axis label is to be invisible or
visible .
Sample time defines with which time interval
the measurements are recorded. 5
possibilities are offered:
− From 2s (max. 1h45min) up to
2min (max. 105h) .
Time axis defines over which time range the
measurements are to be displayed.
− With Automatic the program finds the
optimum display.
− From 9min up to 144h .
Time base defines whether scaling is to be
carried out.
− With Relative the start occurs at
00:00:00.
− With Absolute the current time is
displayed.
Hel
Menu End T
set
T
fix
Mode
Dislayed value
Legend
Sample Time
Time axis
Time base
Temp. scale
Temp. limits
Online graph
Start Record
Hel
Menu Screen T
set
Gra
h
T
set
25.00 T
int
25.01 T
ext
25.02
T °C
27.00
26.00
25.00
24.00
23.00
11:22:00 11:25:00 11:28:00 11:31:00
Rec
Hel
Menu End T
set
T
fix
Mode
Displayed value
Legend
Sample time
Time axis
Time base
Temp. scale
Temp. limits
Tset Tint Text
Tset Tint
Tset Text
Tint Text
Tint
Text
Tset