C–2
Appendix C
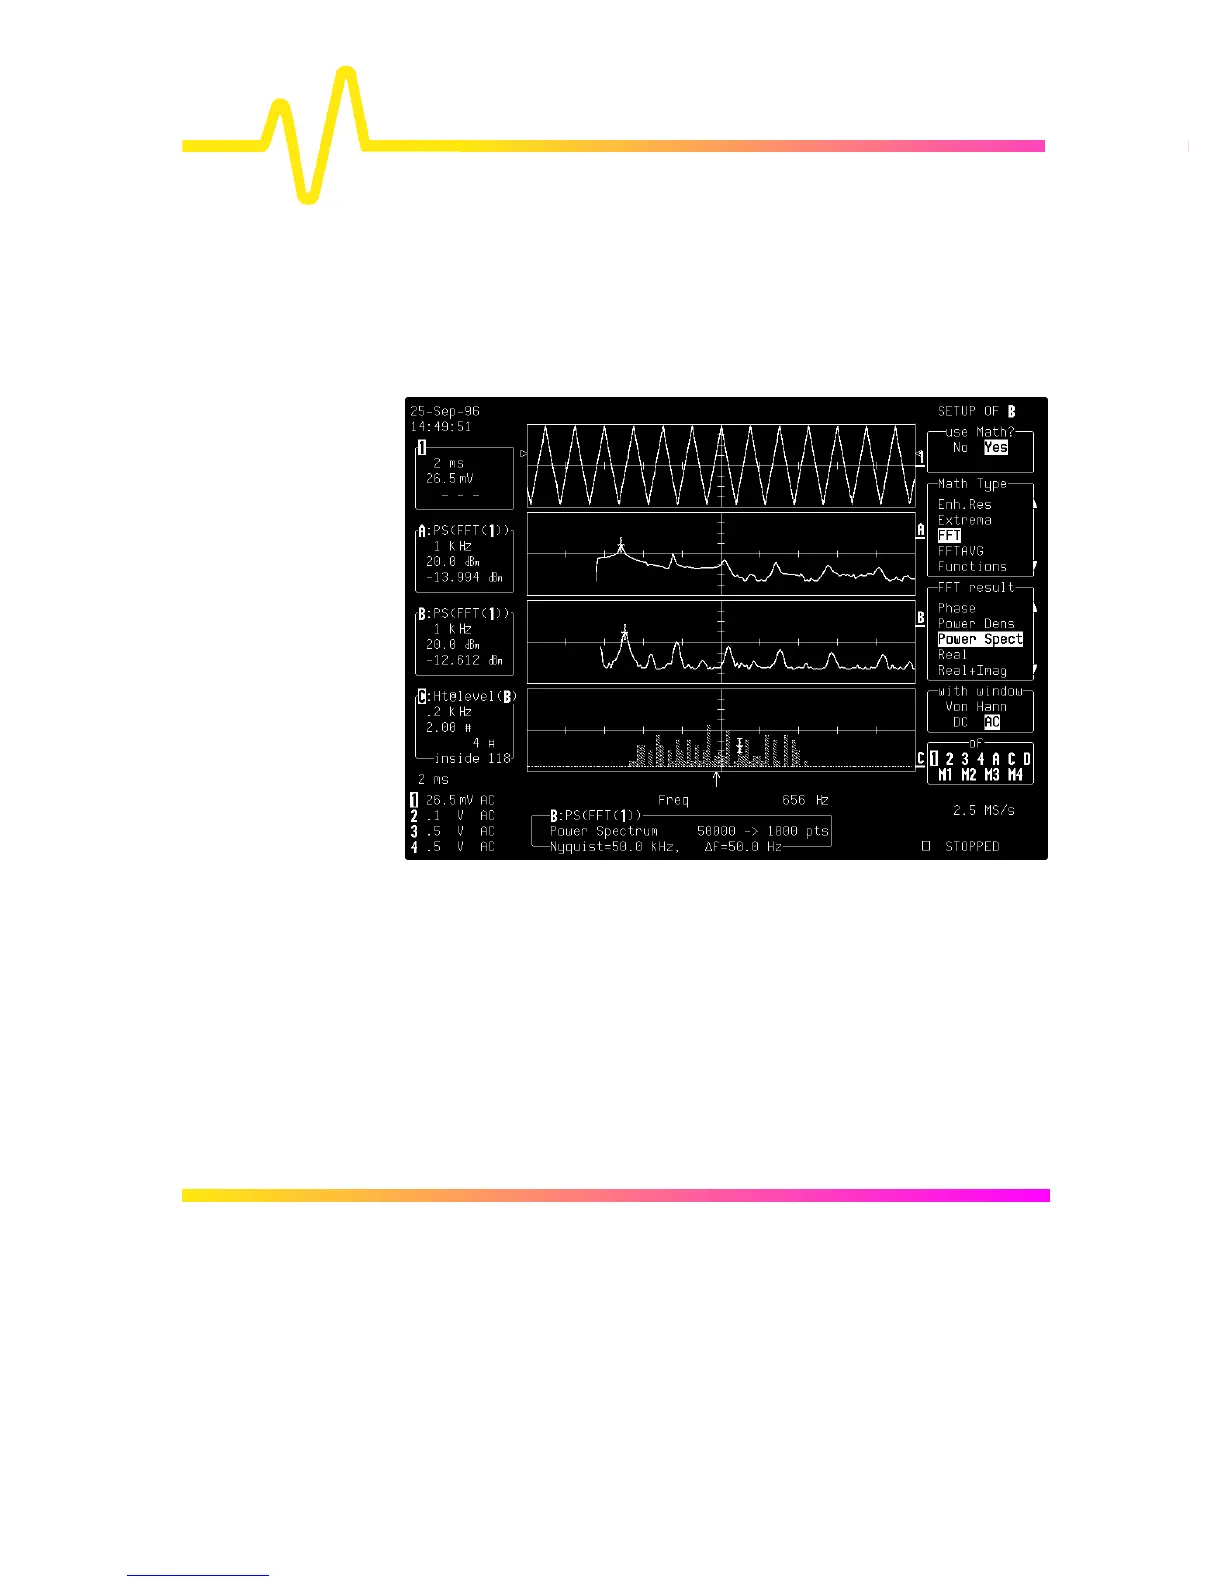
Figure C–1 shows spectra of a swept triangular wave.
Discontinuities at the edges of the wave produce leakage, an
effect clearly visible in Trace A, which was computed with a
rectangular window, but less pronounced in the Von Hann
window in Trace B (see below for leakage and window-type
explanations). Histogramming in Trace C tracks the spread of
the first harmonic.
Figure C–1
Slicing the waveform in the fashion described above is
tantamount to diluting the spectral energy in an infinite number
of side lobes, which correspond to multiples of the frequency
resolution ∆f (Fig. C–2). The observation window or capture time
T determines the frequency resolution of the FFT (∆f=1/T).
Whereas the sampling period and the record length set the
maximum frequency span that can be obtained (f
Nyq
=∆f*N/2).
 Loading...