C–10
Appendix C
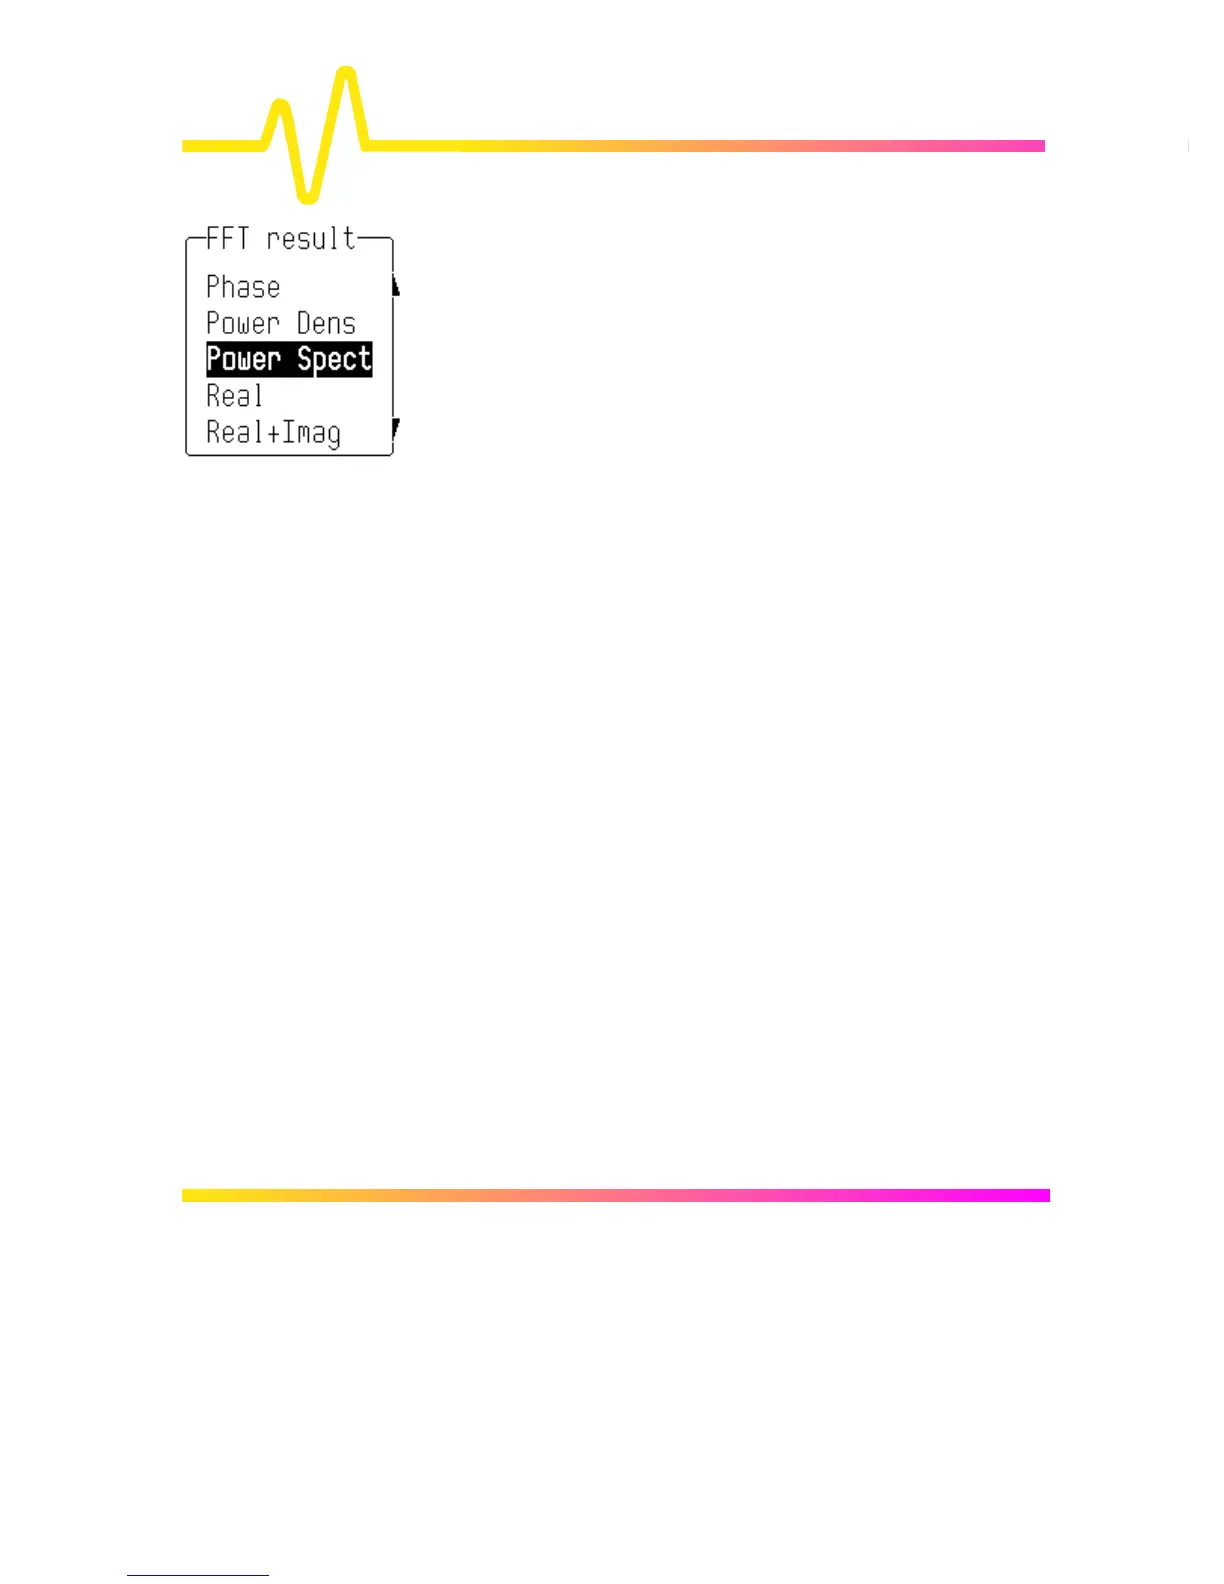
The following selections can be made using the “FFT result”
menu.
Phase
Measured with respect to a cosine whose maximum occurs at
the left-hand edge of the screen, at which point it has 0 °.
Similarly, a positive-going sine starting at the left-hand edge of
the screen has a –90 ° phase. (Displayed in degrees.)
Power Density
The signal power normalized to the bandwidth of the equivalent
filter associated with the FFT calculation. The power density is
suitable for characterizing broad-band noise. (It is displayed on a
logarithmic vertical axis calibrated in dBm.)
Power Spectrum
The signal power (or magnitude) represented on a logarithmic
vertical scale: 0 dBm corresponds to the voltage (0.316 V peak)
which is equivalent to 1 mW into 50 Ω. The power spectrum is
suitable for characterizing spectra which contain isolated peaks.
(dBm.)
Magnitude
The peak signal amplitude represented on a linear scale. (Same
units as input signal.)
Real, Real + Imaginary, Imaginary
These represent the complex result of the FFT processing.
(Same units as input signal.)
 Loading...