E–5
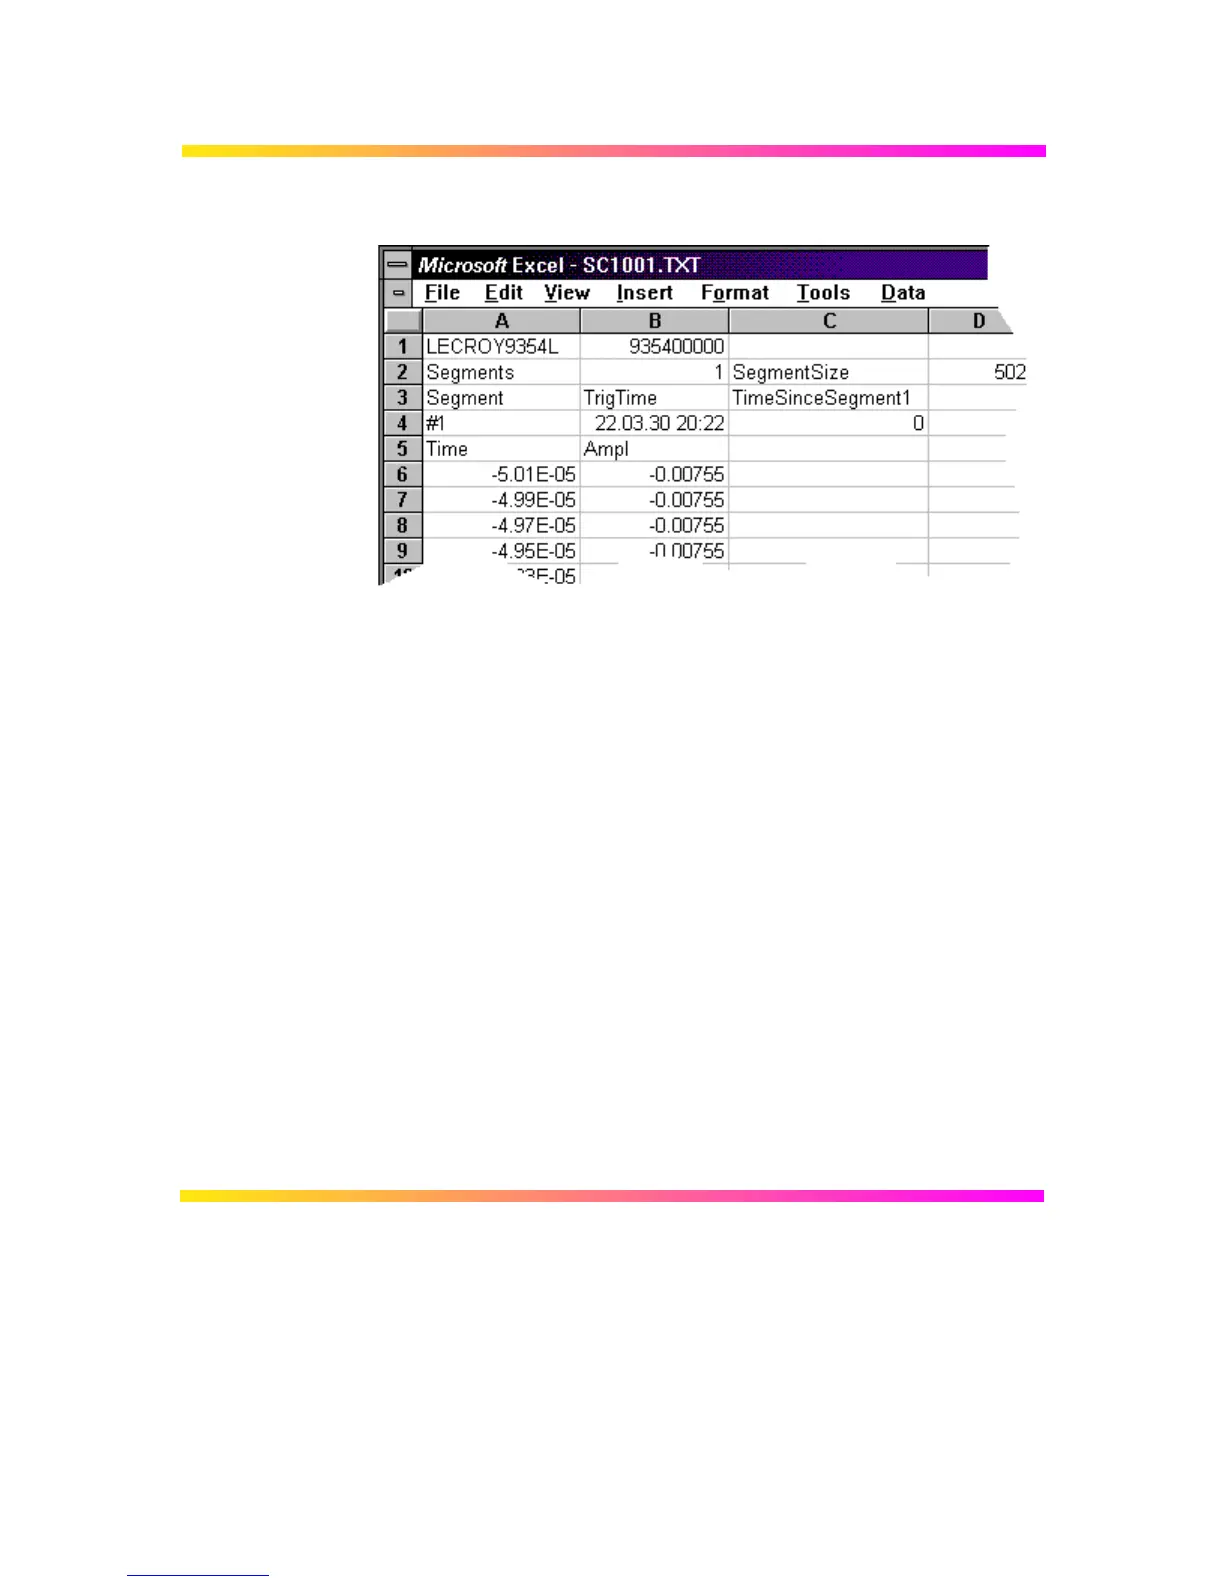
ASCII Waveform Export
Plotting the data from a single-segment waveform requires the use
of a scatter plot based on the data in the first two columns with the
first column used as the X values.
The header created for the Spreadsheet format contains all the
information required to extract various elements of a sequence
waveform. The following Formulae may be used to extract
information such as the start and end row of the data for a given
segment, or the trigger time of a given segment.
SegmentStartRow := (DesiredSegment * D2) + B2 + 5
SegmentEndRow := SegmentStartRow + D2 -1
TrigTime= INDIRECT(ADDRESS(DesiredSegment +3;2;4))
TimeSinceFirstTrig= INDIRECT(ADDRESS(DesiredSegment
+3;3;4))
Plotting the data from all segments using a scatter plot will result in
all segments overlaid (similar to the scope’s display of sequence
traces in persistence mode).
Plotting a Single-
Segment Waveform
Extracting Segments
from Sequence
Waveforms
 Loading...