E–10
Appendix E
Using MATLAB
This example was created using MathWorks’ MATLAB Version
4.2c.1 for Windows.
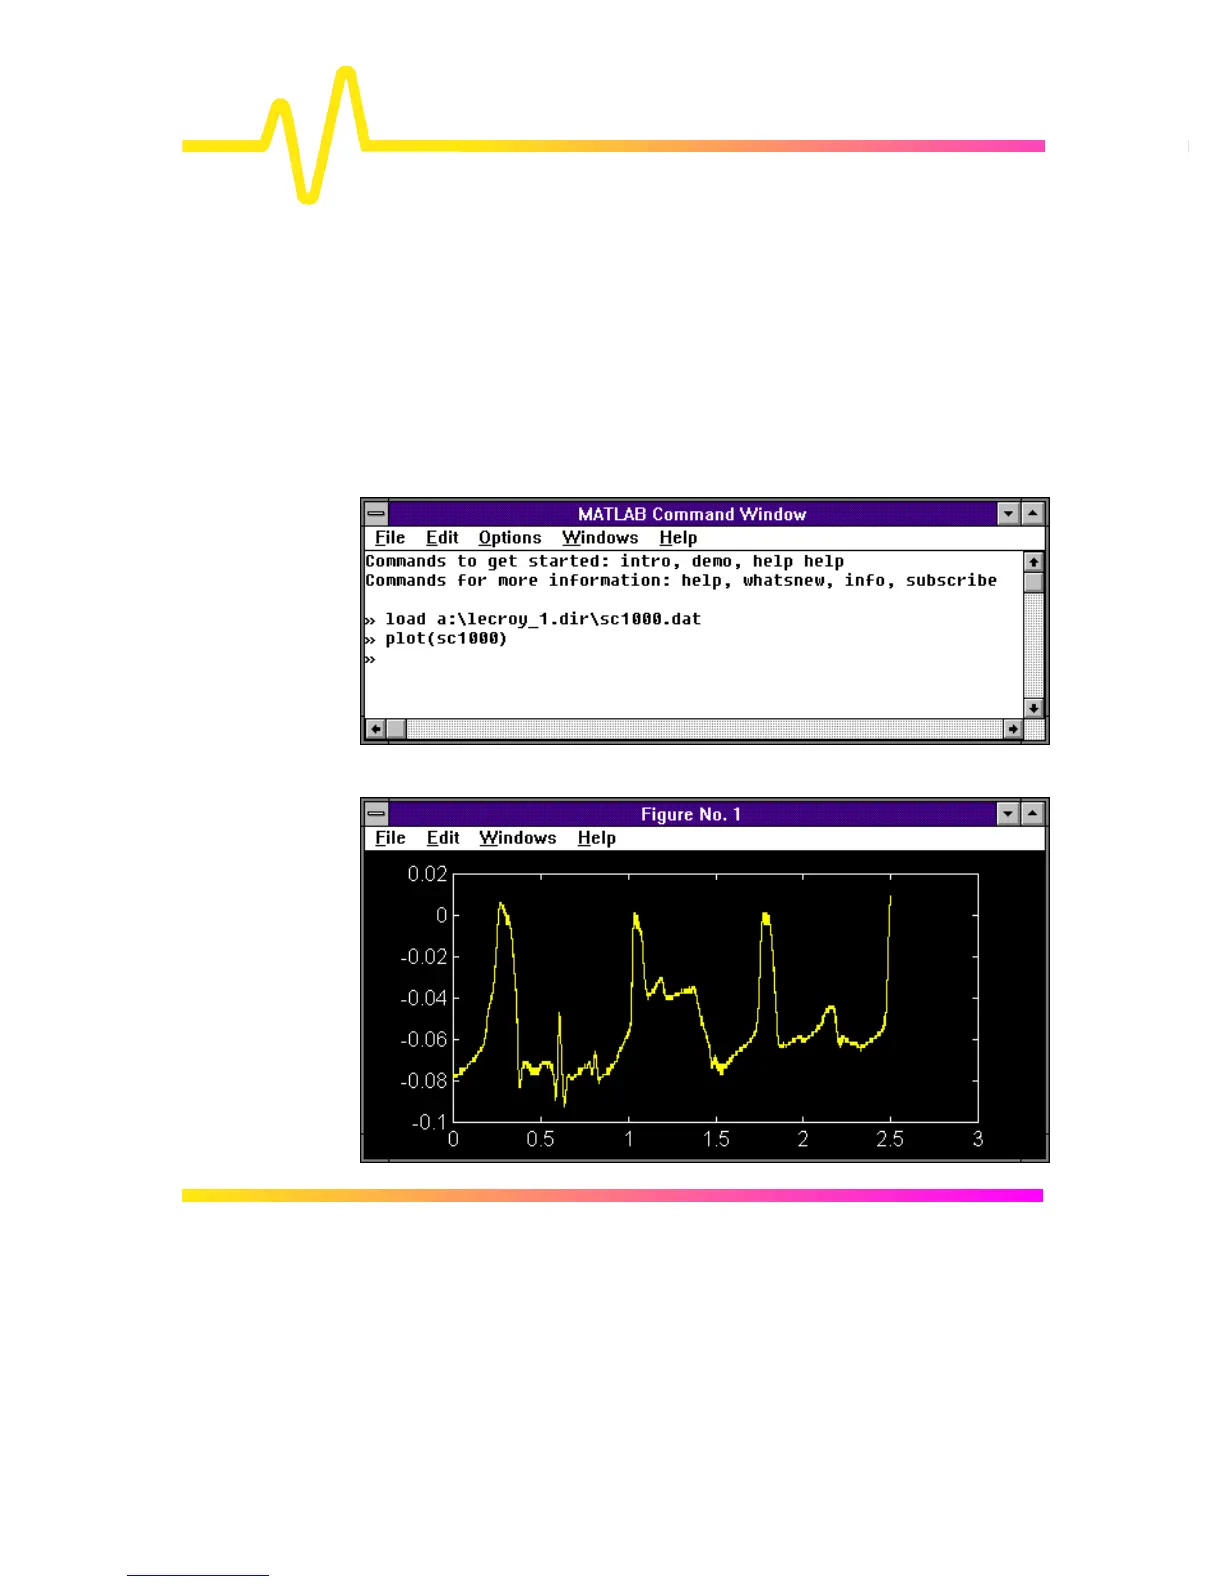
Reading and graphing a waveform in MATLABmay be achieved
with two simple commands, as the following example shows. The
first command loads the file into a matrix which is automatically
named after the file. The second command plots this matrix.
 Loading...