Light
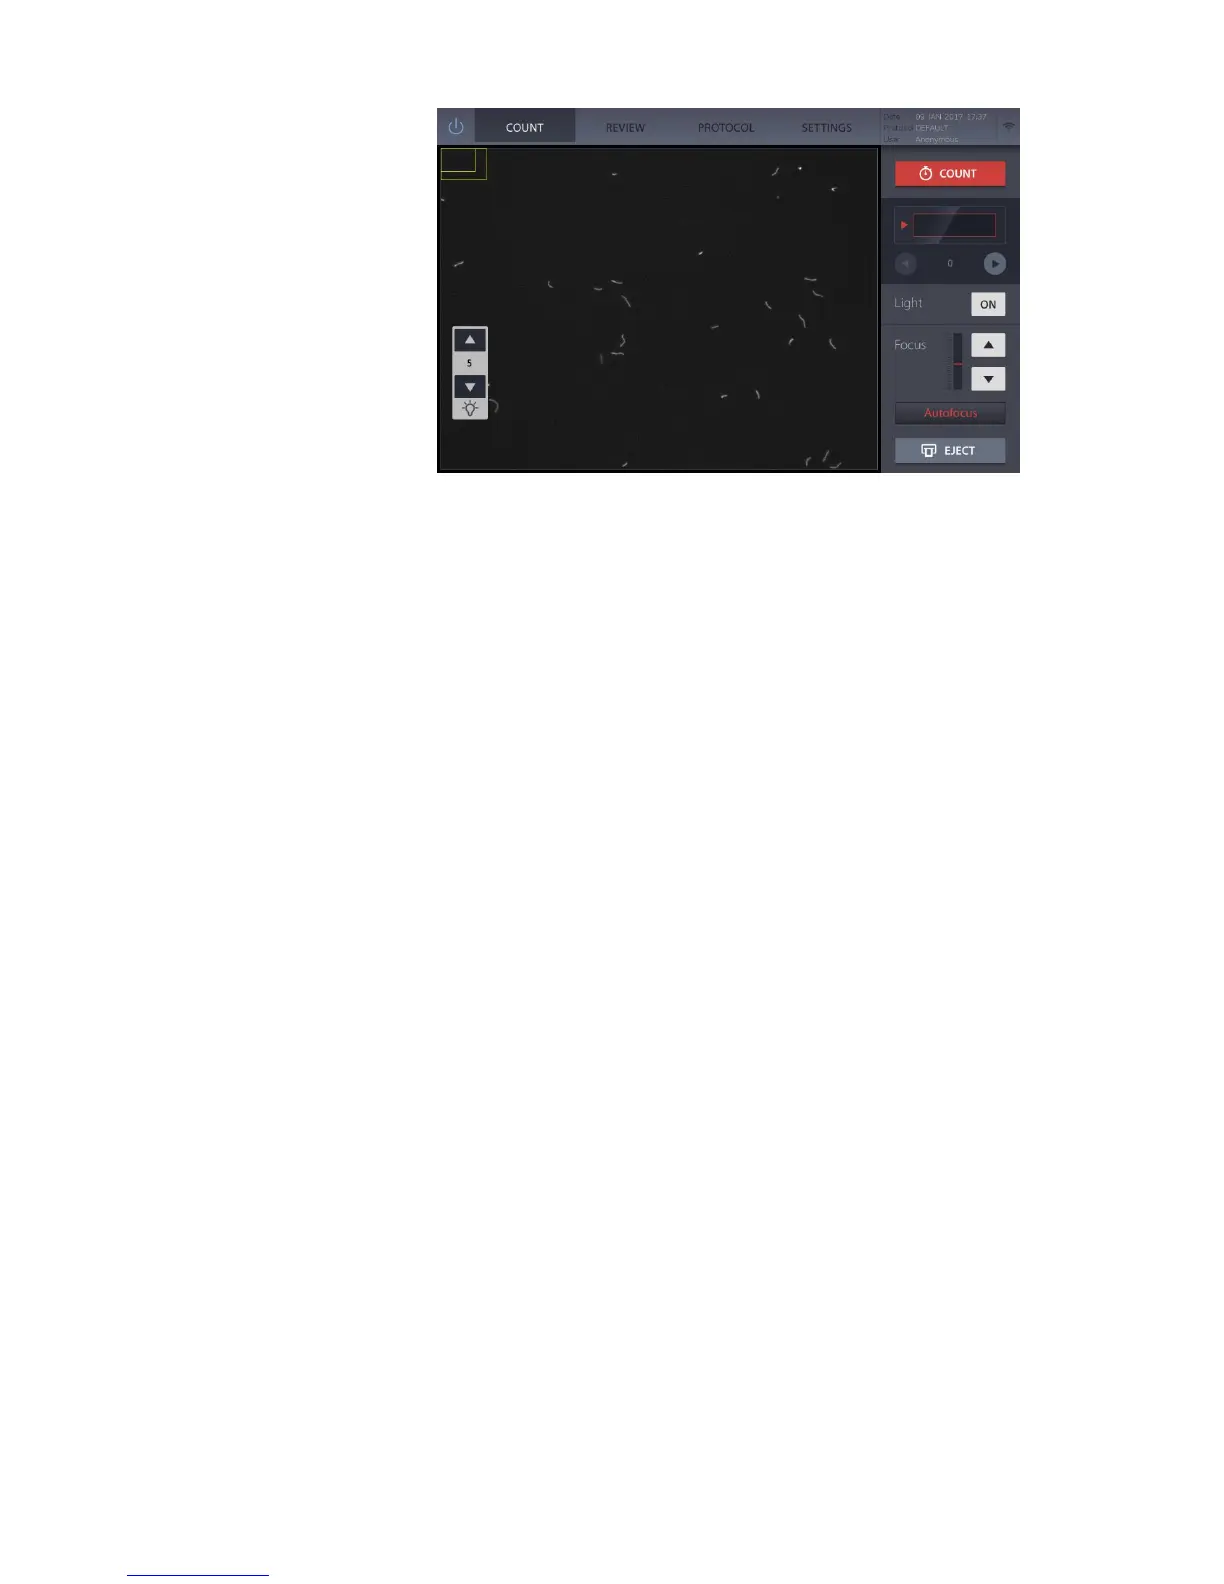
When the light is on, a light control bar will appear in the bottom left corner of the screen.
Adjust the light intensity as needed by pressing the light control bar arrows. Take care to
prevent sample photobleaching.
Important! Adjusting intensity levels may affect counting results. For optimal
counting, do not oversaturate with light.
For total cell counting, the recommended level is 5. For viable cell counting, the
recommended level is 9. When counting beads, lower the intensity to the ‘bead’ setting.
Scrolling
The QUANTOM Tx
™
can capture up to 20 images. Use the arrows under the COUNT
button to scroll through the different fields of view.
Focusing
The QUANTOM Tx
™
has an autofocusing algorithm that works in tandem with the
focusing mechanism. Press Autofocus to bring cells into focus or adjust the focus
manually using the arrows in the Focus control bar.
Zoom
Zoom in or out by moving two fingers farther apart or closer together while touching the
capacitive touchscreen. The boxes in the top left of the image represent the field of view of
the imaging equipment. The inner box is the current view and the outer box is the
superview. The size and location of the inner box will change with the magnification of the
screen.
To start counting, press COUNT. When the counter is set to autofocus during counting, the
instrument will readjust the focus as necessary as the slide is moved to capture multiple
images along the sample chamber.
Counting time will vary depending on cell concentration, the number of images captured,
and the protocol used. With the QUANTOM Tx
™
set to autofocus during counting with the
DEFAULT protocol, cell samples with a concentration of ~1 x 10
7
cell/mL will take
approximately one minute to count when capturing and analyzing 20 images.
When counting is complete, the results will appear and the slide will be ejected
automatically from the instrument.
Scroll through cell images and corresponding data (pg. 10).
Press Histogram & Gating to see a graphical representation of the data (pg. 10).
Calculate subsequent dilutions with the Dilution Calculator (pg. 11).
Save results by pressing the Save & Print button (pg. 11).
Count the sample in the second chamber. Remove the slide, reinsert the second chamber
side first, and press the Next Count button. Be careful not to jostle or disturb the sample.