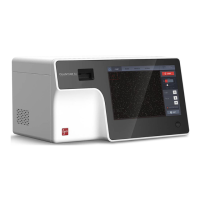
Cell count results will appear once counting is complete.
To the left of the screen is a summary of count results, including the total cell concentration,
average fluorescent object size, total cell number, and the dilution factor applied to calculate
the concentration. Use the arrows beneath to scroll through the captured images. Press the
Tag button above the image to tag what was identified as a cell according to the protocol
used. Below the image is the number of cells identified in the image.
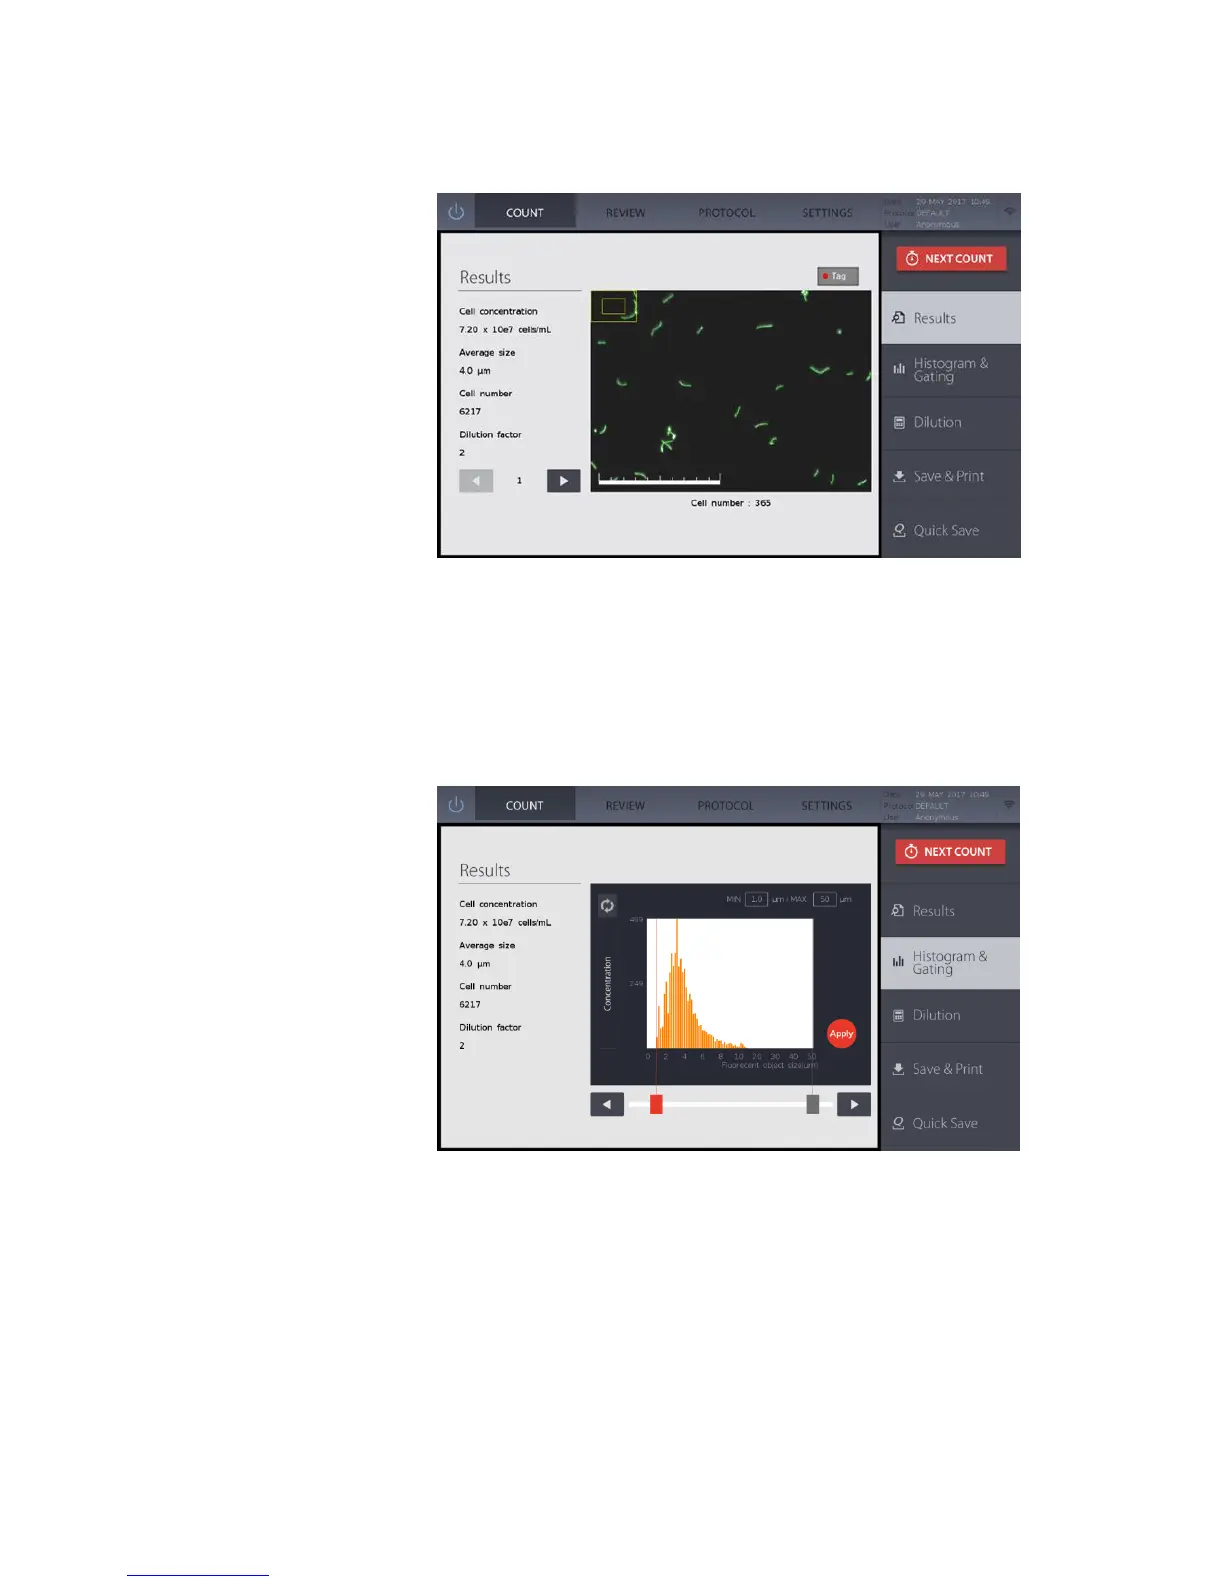
Press Histogram & Gating to open the histogram window.
Cell concentration or number can be graphed according to fluorescent object size. Set limits
on acquired data and choose to focus on a certain fluorescent object size range.
Select the desired light grey limit icon. The selected icon will become red. Press the arrows
on either end of the bar to alter the fluorescent object size limits. Press Apply to set gating
limits. Count results will just accordingly.
Press the icon above the Y-axis to alternate between total cell concentration and cell number.