4-22
Buttons Function
Print Print current calibration parameters and curve.
Return Click this button to return to the main screen.
CAUTION
The replacement of certain components should be followed with
calibration. Otherwise, you may get unreliable result.
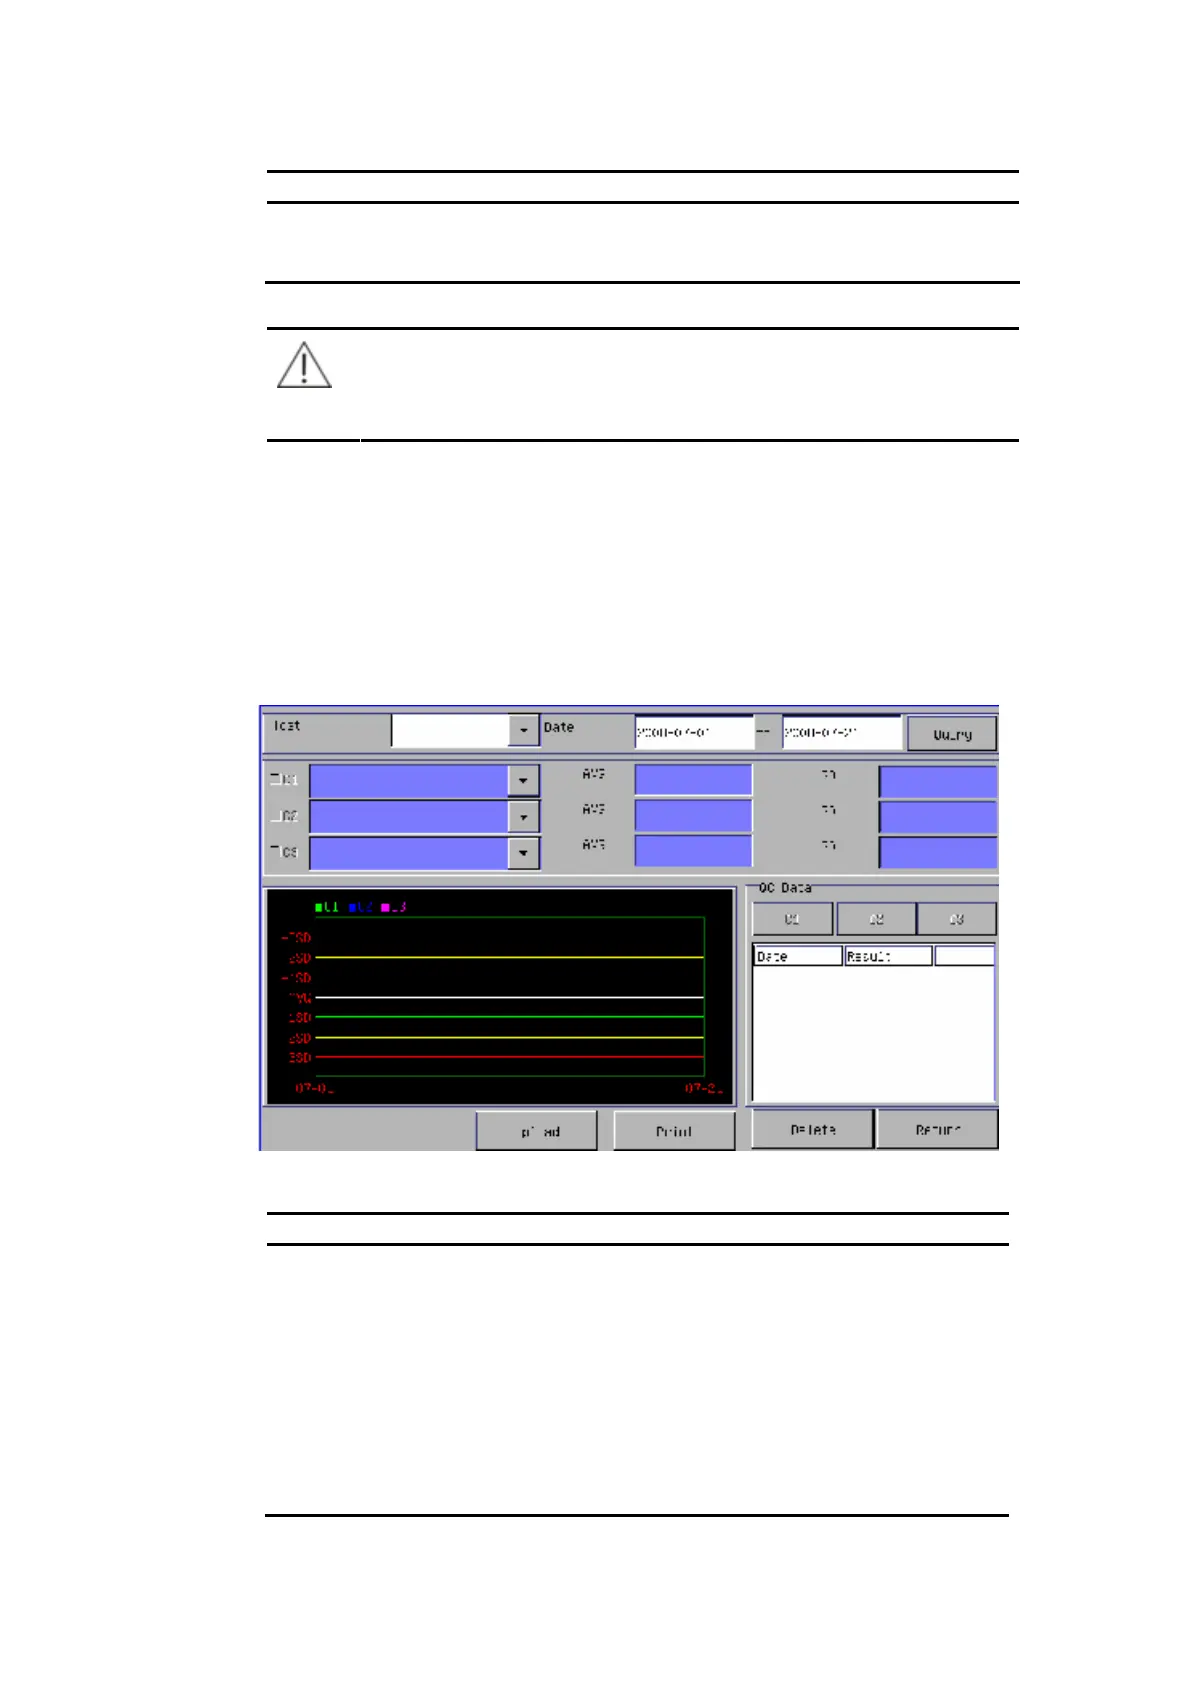
4.5 QC
You can view the QC result and QC reaction curve, and check whether the test is out
of control and print QC reaction curve in the QC screen.
Figure 4-14 QC
The following table explains the parameters on the screen.
Parameter Description
Test All the tests with QC information set will be listed.
Select a test to view the QC result.
Date The maximum range is one month(31 days).
Control C1-C3 can be selected.
Lot No. The latest 5 lot No. will be displayed. The default is the most
recent lot No..
SD Standard Deviation of the control.
AVG Concentration of the control.
 Loading...