6 Image Acquisition
Operator’s Manual 6 - 39
9. If necessary, repeat steps 3-8 to track the next section.
NOTE:
The screen displays the result of the current section, and the bull’s eye graph shows the
average value of all the tracked sections.
10. Tap [Data Export] to export analyzed data.
11. Tap [Exit] to exit.
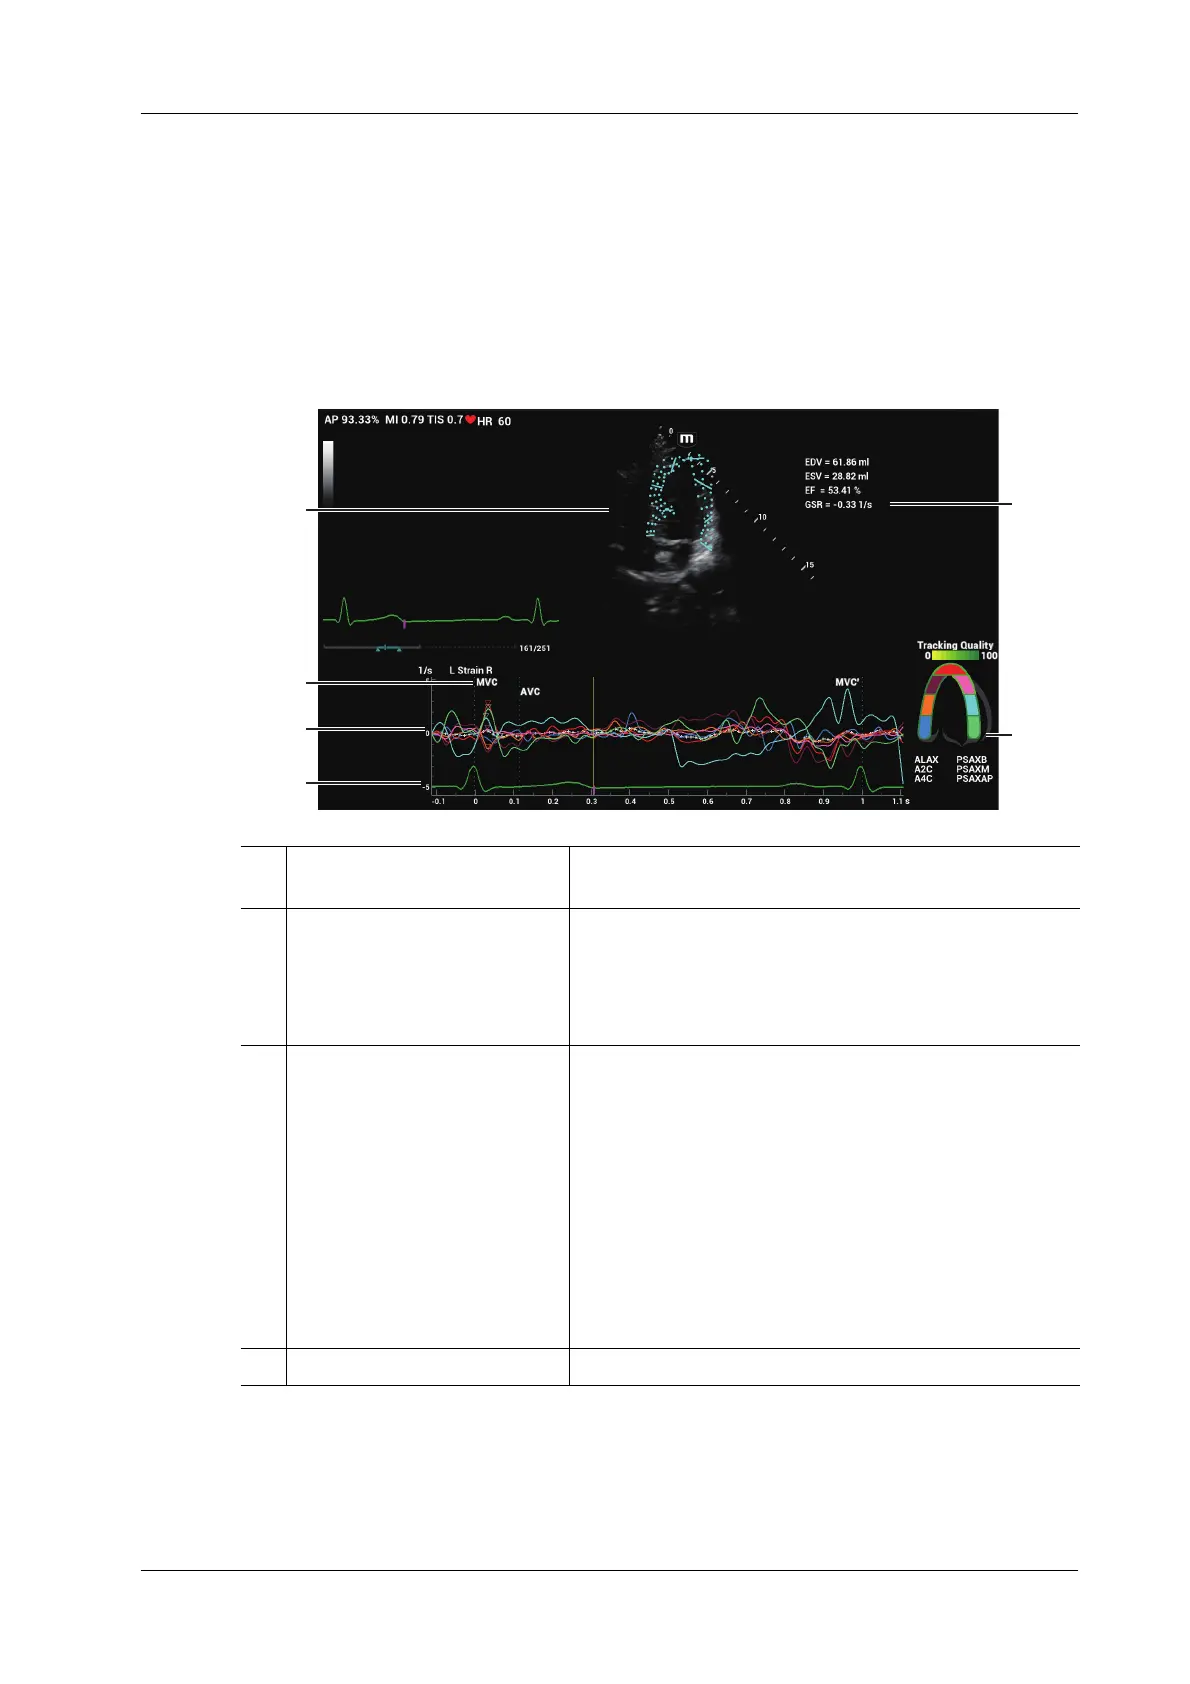
6.14.2 Screen Display of Tissue Tracking QA
1 Displays image used to generate
trace curve
/
2 Displays corresponding time of
AVO (aortic valve open)/AVC
(aortic valve close)/MVO
(mitral valve open)/MVC (mitral
valve close).
/
3 Display curve: Velocity/
Displacement/Strain/Strain
Rate.
Each curve on the image is matched with a certain segment
in the cardiac segmentation model (6), identified by
different colors.
• Velocity curve: X-axis represents time (s); Y-axis
represents velocity (cm/s).
• Displacement curve: X-axis represents time (s); Y-axis
represents displacement (mm).
• Strain curve: X-axis represents time (s); Y-axis
represents deformation of the tissue (%).
• Strain-rate curve: X-axis represents time (s); Y-axis
represents strain by time (s
-1
).
4 Displays ECG trace /
6
1
2
3
4
5

 Loading...