EasyManuals Logo

Neptune Technology ProCoder R900i User Manual

Neptune Technology ProCoder R900i
54 pages
To Next Page IconTo Next Page
To Previous Page IconTo Previous Page
Page #38 background imageLoading...
Page #38 background image
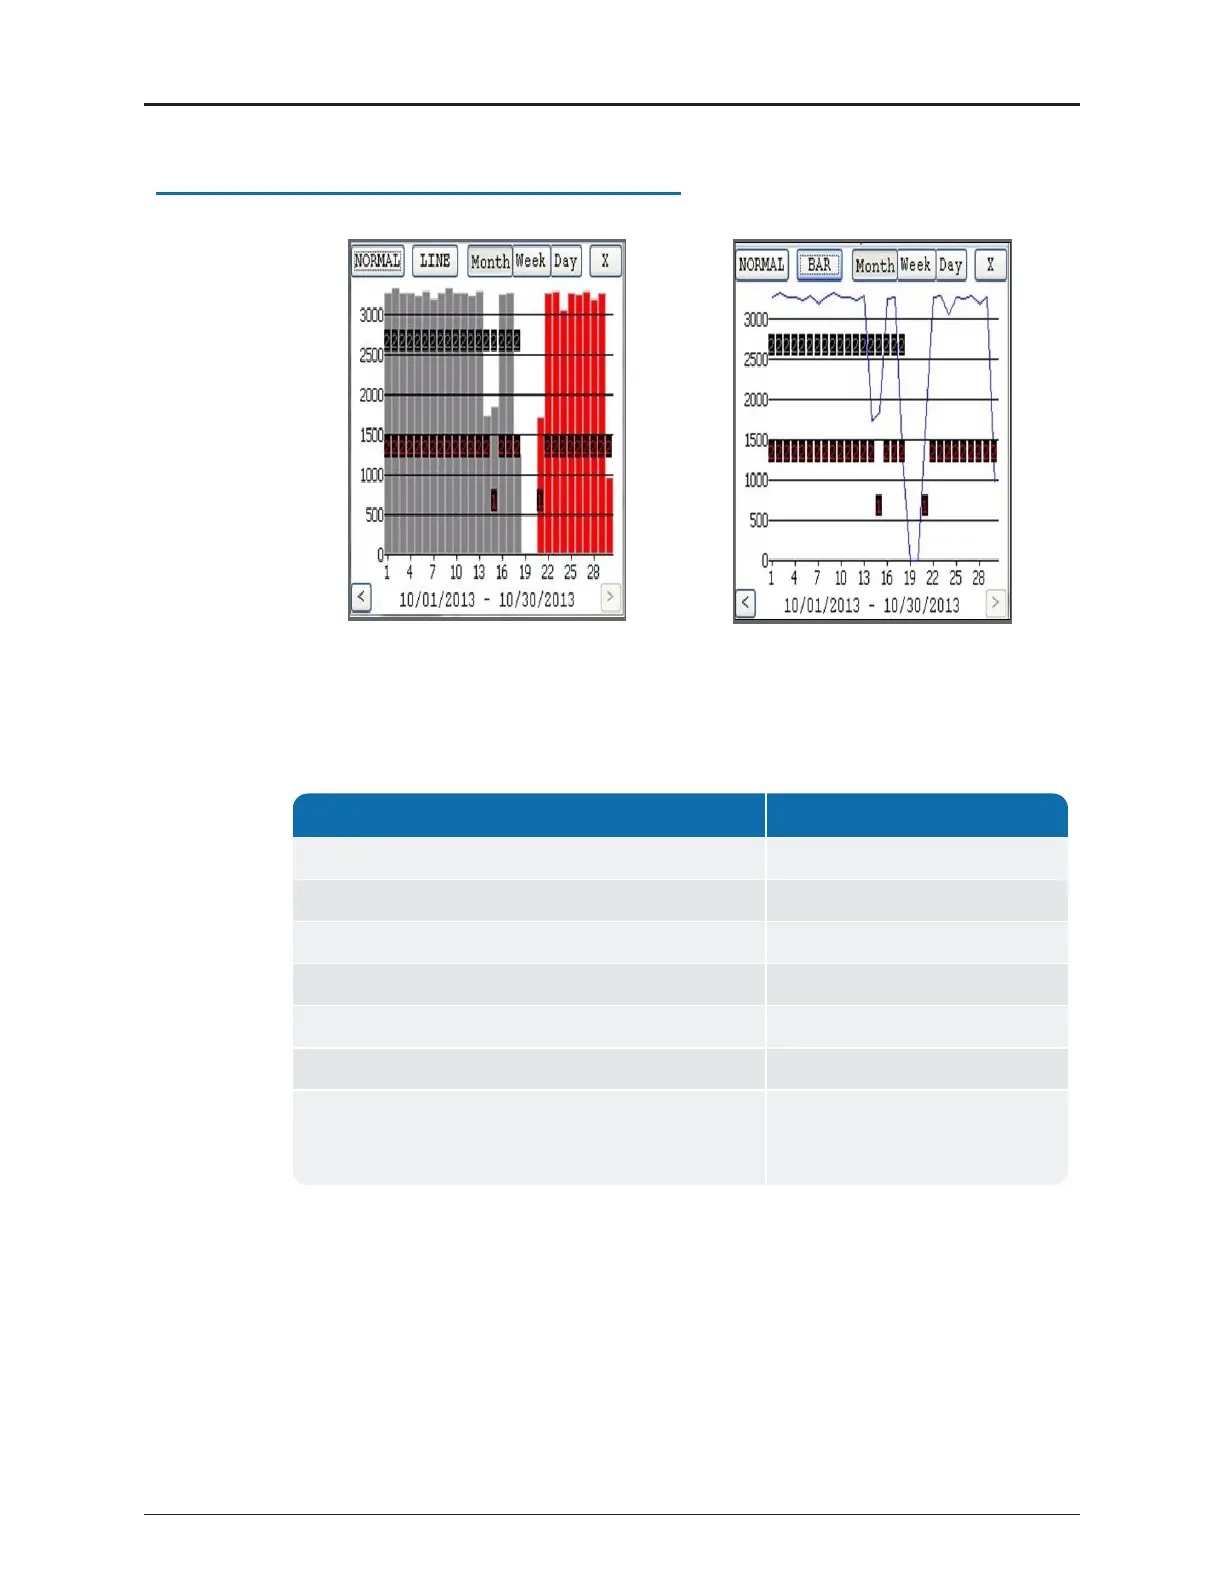
Sample Data Logging Graphs
The following are two examples of the graphs produced with data logging.
Figure 27 – Examples of Data Logging Graphs
Color Code Description
1 red bar Intermittent Leak
2 red bars Continuous Leak
1 gray bar Minor Backflow
2 gray bars Major Backflow
Blue bars No Flags
Red bars Leak
Gray bars (If the Backflow flag and Leak flag appear at
the same time, the Backflow (gray bars) has
precedence over the Leak.
Backflow
Table 6 – Data Logging Graph Legend
26 ProCoder™)R900iInstallation and Maintenance Guide
Chapter 5: Data Logging Extraction

Table of Contents

Questions and Answers:

Question and Answer IconNeed help?

Do you have a question about the Neptune Technology ProCoder R900i and is the answer not in the manual?

Neptune Technology ProCoder R900i Specifications

General IconGeneral
BrandNeptune Technology
ModelProCoder R900i
CategoryMedia Converter
LanguageEnglish