Element Manager User’s Manual Nimbra OneSerie Trunks • 91
©2006 Net Insight AB, All rights reserved
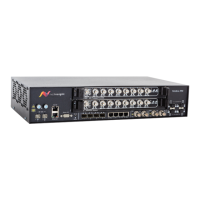
Figure 88. The start web page for Trunks
The sub-sections are:
• Interfaces present the various trunk modules and monitor the state of
them.
• Perf. Monitor. Performance monitoring (PM) is the process whereby
transported data in a tele- or data communication network is supervised for
quality deterioration. With help of this process, service level agreement
(SLA) reports can be produced and preventive maintenance work can be
performed at an early stage before more severe faults occur in the network.
Performance monitoring counters via SNMP. G.826-like performance
counters on trunk, interface and connection. For further information
please refer to section.
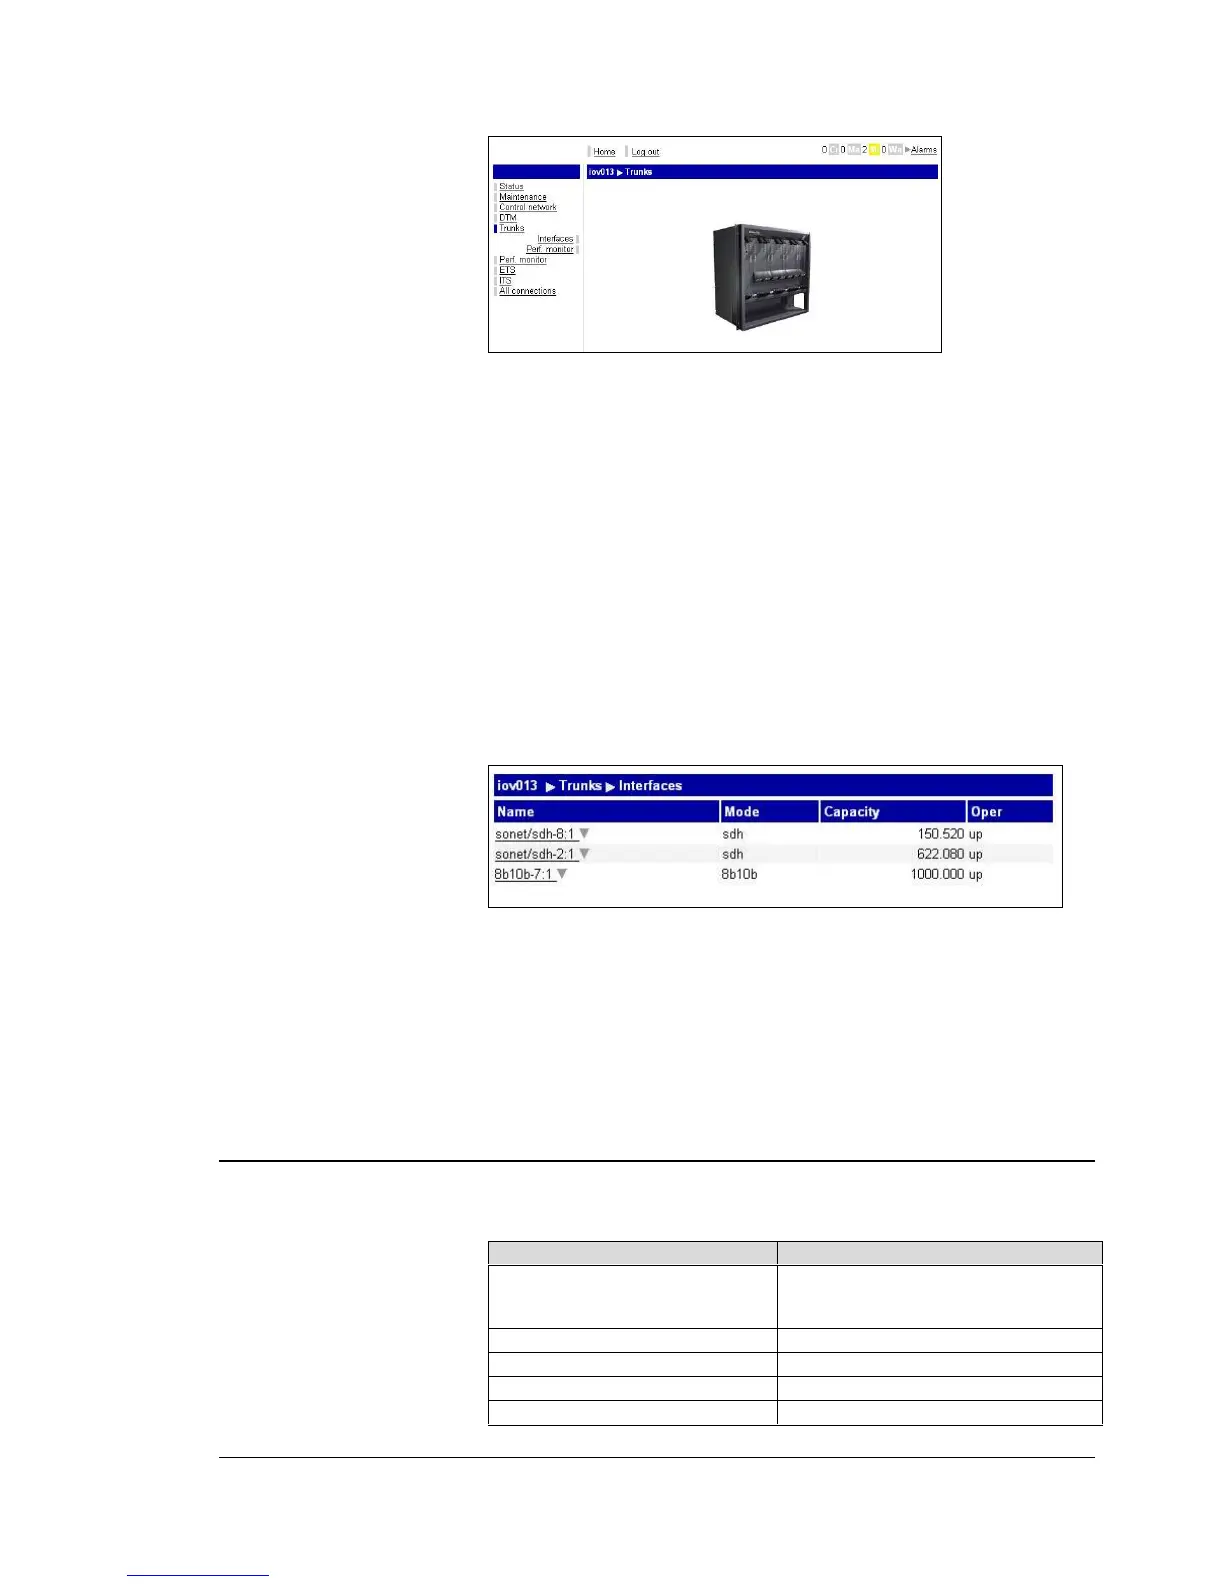
1. Navigate to the Trunks|Interface menu to enter the list of the trunks.
Select the trunk that should be configured or inspected, by clicking on the
Name of the trunk.
Figure 89. Trunk Module
The table presents the following information:
• Name presents the name of the interface, 8b10b or Sonet/sdh.
• Mode: Shows the mode of the interface, 8b10b, sdh or sonet.
• Capacity: Shows the total capacity of the trunk interface in Mbps.
• Oper: Shows the operative status of the trunk interface.
Editing the OC-48/ STM-16 X-ADM Module
The Read-only parameters are:
Parameter name Description
Interface name The interface id, Sonet/sdh. Written as
“nameX:Y” Where X is position of the
card and Y position of the port.
Oper. status The operational status of the board.
Speed The capacity, 2488.320 Mbps.
Transceiver temperature Presents the temperature of the card.
Transceiver laser bits Presents the ampere of the laser.
 Loading...