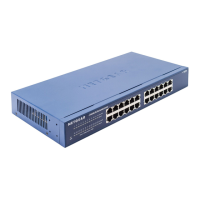
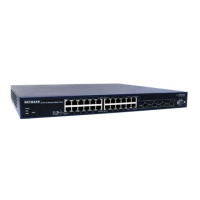
S350 Series 24-Port (PoE+) and 48-Port Gigabit Ethernet Smart Managed Pro Switches
Monitor the System User Manual310
3. In the address field of your web browser, enter the IP address of the switch.
If you do not know the IP address of the switch, see
Discover or Change the Switch IP
Address on page 12.
The login window opens.
4. Enter the switch’s password in the Password
field.
The default password is password.
The System Information page displays.
5. Select Monitoring > Logs > Memory Log.
The Memory Log page displays.
6. Select one of the following
Admin Status radio buttons:
•
Enable. Enable system logging. This is the default setting.
•
Disable. Prevent the system from logging messages.
7. From the Behavior menu, specify the behavior of the log when it is full.
• Wrap. When the buffer is full, the oldest log messages are deleted as the system logs
new messages.
•
Stop on Full. When the buffer is full, the system stops logging new messages and
preserves all existing log messages.
8. From the
Severity Filter menu, select one of the following severity levels:
• Emergency (0). System is unusable.
• Alert (1). Action must be taken immediately
.
• Critical (2). Critical conditions.
• Error (3). Error conditions.
• Warning (4). W
arning conditions.
•
Notice (5). Normal but significant conditions.
• Informational (6). Informational messages.
• Debug (7). Debug-level messages.
Note: A log records messages equal to or above a configured severity
threshold.
9. Click the Apply button.
Your settings are saved.
The Memory Log table displays on the Memory Log page.
The Total number of Messages field displays the number of messages the system logged
in memory
. Only the 200 most recent entries are displayed on the page.
The rest of the page displays the Memory Log messages.
The format of the log message
is the same for messages that are displayed for the message log, persistent log, or

 Loading...
