83
Errors and status indicators
Errors and status indicators
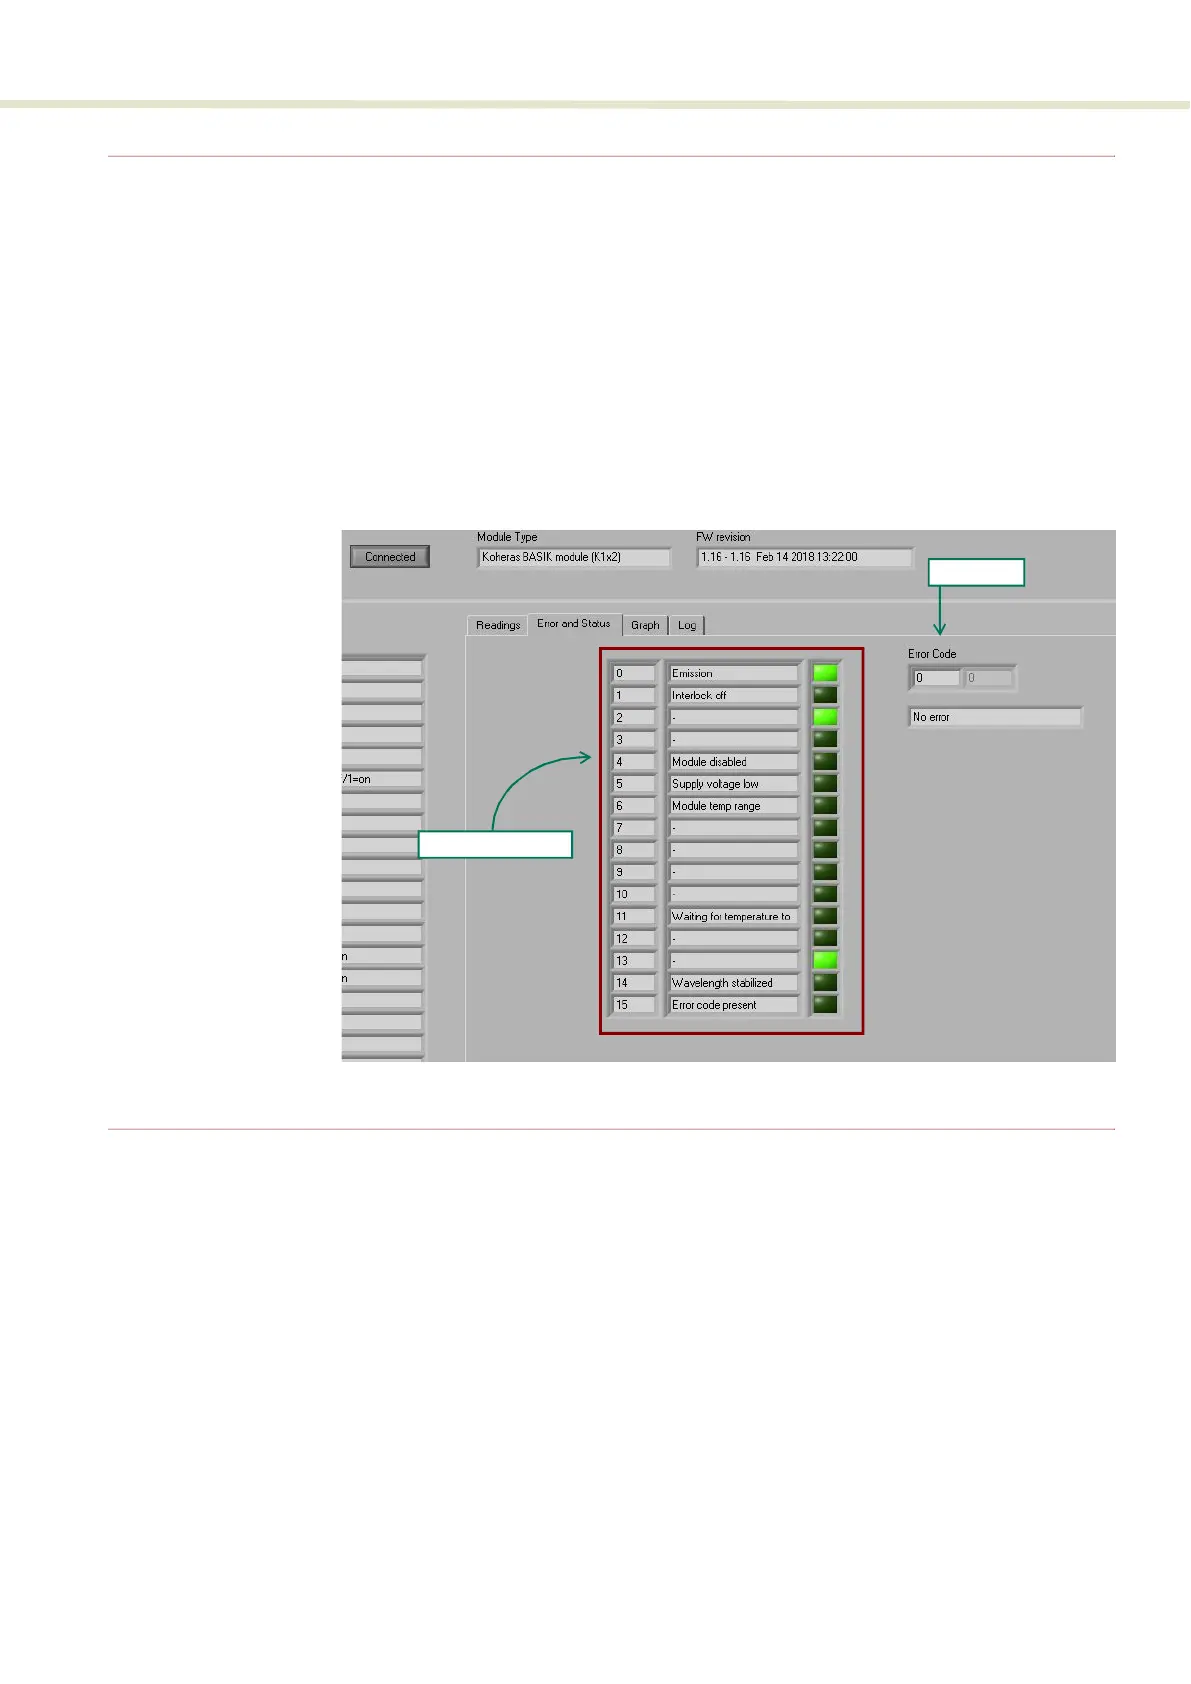
For each module, click on the Error and Status tab to view the status indicators
and if any error codes are displayed.
Status indicators The status indicators will be lit green if the condition in the text is true.
Error codes If an error code is listed and cannot be cleared contact NKT Photonics support,
see “Support contact details” on page 106.
Figure 58 Error and status tab
Graphing
As shown in Figure 59, you can graph the values of selected parameters by
clicking on the Graph tab and selecting the parameter you want to graph. To use
the graphing function:
1. Select the parameters to graph from the drop-down menu at the left/right y-
axis and bottom x-axis of the graph.
2. Modify the left/right y-axis and x-axis maximum range with the input boxes.
3. Set the sample number and rate using the input boxes to the left of the graph.
Status indicators
Error code
 Loading...