Comprehensive Manual46
© 2018 Nortek AS
length Cell size mm. For profiling instruments, the measured region starts at Range to first cell mm
from the transducer and ends at Range to last cell mm from the transducer with each cell being Cell
size mm in length.
The Power level setting is used to adjust the amount of power supplied to the active transducer
during transmit. Under normal situations, using a setting of High is appropriate since this will provide
the highest signal to noise ratio.
For general recommendations for sampling in specific environments, check out these sections:
Things to Consider, Applications and Common Configuration Scenarios.
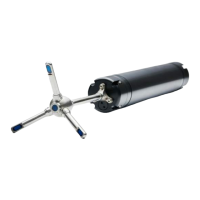
2.3.5 Mounting and Handling the Probe
When using an instrument in a laboratory flume, it is recommended to ensure alignment of the
coordinate system. For a quick setup, aligning everything by eye works surprisingly well if you have
good references to align against (e.g. flume walls). For a more rigorous setup, two spirit levels
mounted orthogonal to one another can be used to make sure the mounting fixture and probe are
level. This assumes the top of your flume is level since everything is usually mounted on a cross
piece to it.
Follow these guidelines when you mount your Vectrino Profiler:
Make sure that there are no obstructions between the sensor and the focal point (sampling
volume) located about 5 cm from the transducers.
When mounting your sensor, use the recessions to strap it to the structure. Never use the probe
stem as mounting point.
Consider the effects of large objects on the flow itself. A rough rule of thumb is that objects disturb
the flow as far as 10 diameters away from the object. Flow disturbance is greatest directly
downstream in the wake behind the object.
All acoustic transducers must be submerged during data collection. Operating your Vectrino
Profiler when the transducers are out of water will not cause any damage, but your data will be
meaningless. For side-looking probes, it is possible to collect 2D-data with only the lower receiver
arms submerged.
The best quality is achieved if the main flow direction is perpendicular to the transmit axis. Flow
directly into the transmit axis should be avoided.
Make sure your mounting structure is stable. Small vibrations in the mount can generate large
accelerations in the data.
After mounting the Vectrino Profiler, run a Probe Check as a diagnostic tool to ensure that the
sampling volume and signal strength looks good.
When two probes are close together, there is a chance of acoustic cross interference. Mostly, this
should happen when one unit is transmitting and the other is receiving. For this reason, it is probably
wise that the two probes are not mechanically coupled. Otherwise, the cross interference is going to
be a function of the particle concentration - lots of particles give strong return signal and the effect of
the cross interference will be less important. Please be aware that the transmitters in the two
systems are asynchronous - even if the data collection is synchronized using the synch input/output
lines. This also means that a test to check for cross interference should be left to run for at least 5
minutes.
2.3.6 Data Handling
The Vectrino Profiler software saves data in binary files (.ntk), which are easily converted to Matlab
structured arrays or ASCII format files, using the conversion module in the software.
Matlab: The .mat file contains Data and Config structured arrays. Each array contains a "Comments"
and "Units" field that describe the contents of each structure.
ASCII:
The .hdr file is a self-documented table
The .dat file contains velocity data at the full sample rate
 Loading...