Using a Velocimeter 47
© 2018 Nortek AS
ASCII files are easily imported into most spreadsheets and data analysis programs
QA/QC
Check the Looking at Velocimeter Data section.
Typical processing tasks:
1. Assess data quality (QA/QC)
2. Data screening
3. Statistics to describe the flow (mean, variance)
4. Spectral Analysis (turbulence, waves)
2.4 Things to Consider
This section contains an collection of things to be aware of when using a Velocimeter.
2.4.1 Probe Check
The Probe Check is a powerful tool to give insight into the operation of the instrument. This tool
produces long average amplitude vs. range profiles for each beam when data collection is started,
and thus gives you "eyes" onto the region where the instrument is making measurements by
showing how the signal varies with range.
Vector: The probe check data is available in two ways: Before and after each burst a probe check is
made, or at the beginning of the measurement when selecting Continuous mode. Continuous probe
check can be gathered if the recording to disk function is enabled before starting a probe check in
the Vector software (Online > Start Probe Check)
After a binary to ASCII conversion it ends up in the .pck file as explained in the .hdr file. ExploreV
does not handle the probe check data so you will need to use another program like Matlab to plot
this data. Note that when recording to disk, the data will be in binary mode. The format is described
in the System Integrator Manual.
Vectrino and Vectrino+: Click Data Collection > Start Probe Check. When exporting data using the
"Data Conversion" function the data will be automatically produced if it is available. Look in the
directory where the data file is located, and after conversion you will see a few additional files
created. The instrument configuration information and other (data) file formats are found in the *.hdr
file. The probe check data (if it is contained in the data file) will be in a file with the suffix *.pck.
ExploreV does not handle the probe check data so you will need to use another program like Matlab
to plot this data.
Vectrino Profiler: The Probe Check must be enabled in the Configuration Dialog. The probe check
data can be found in the "Data" structure when converting the data to Matlab format
(ProbeCheckBeam*).
The probe check output in the first figure below is from a Vectrino, but a similar output is expected
from the Vector and Vectrino+. Note the amplitude at the beginning of the sampling volume (A), the
nice gaussian peak that indicates the sampling volume (B) and the peak corresponding to the
bottom (C). Also note that the signal strength decrease to the noise floor between the measurement
volume and the bottom, and that all colored graphs show roughly the same amplitude and profile
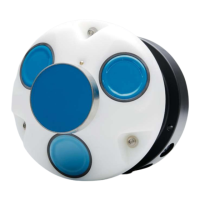
shape. The four graphs correspond to each of the four receive beams. Graphs are scaled in distance
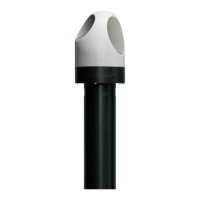
in mm from the transmit transducer, parallel to the transmit beam. This is also relevant for the side-
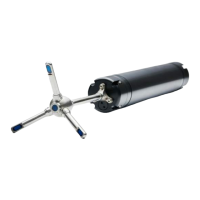
looking probe. The peak in beam 2 should reach over 100-150 counts. For the Vector, the sampling
volume is located at 150 cm from the probe, not 5 cm as for the Vectrino (10 cm for the field version)
 Loading...