54
5.2.2 Time signal analysis
The list of devices and their recorded signals appear in the Navigation pane. By drag and drop or
through double click, the signals are displayed in different types of diagrams.
Available diagrams:
Instantaneous signals: Instantaneous, cursor, and calculation
RMS, DC: The according value as time diagram, cursor, and calculation
Phasor: Magnitude and phase time diagram, cursor, and calculation
df/dt: f, df/dt cursor, and calculation
Binary: Binary trace, and GOOSE packets for a mapped binary signal
Traffic: Byte/s, packets/s, cursor, and calculation
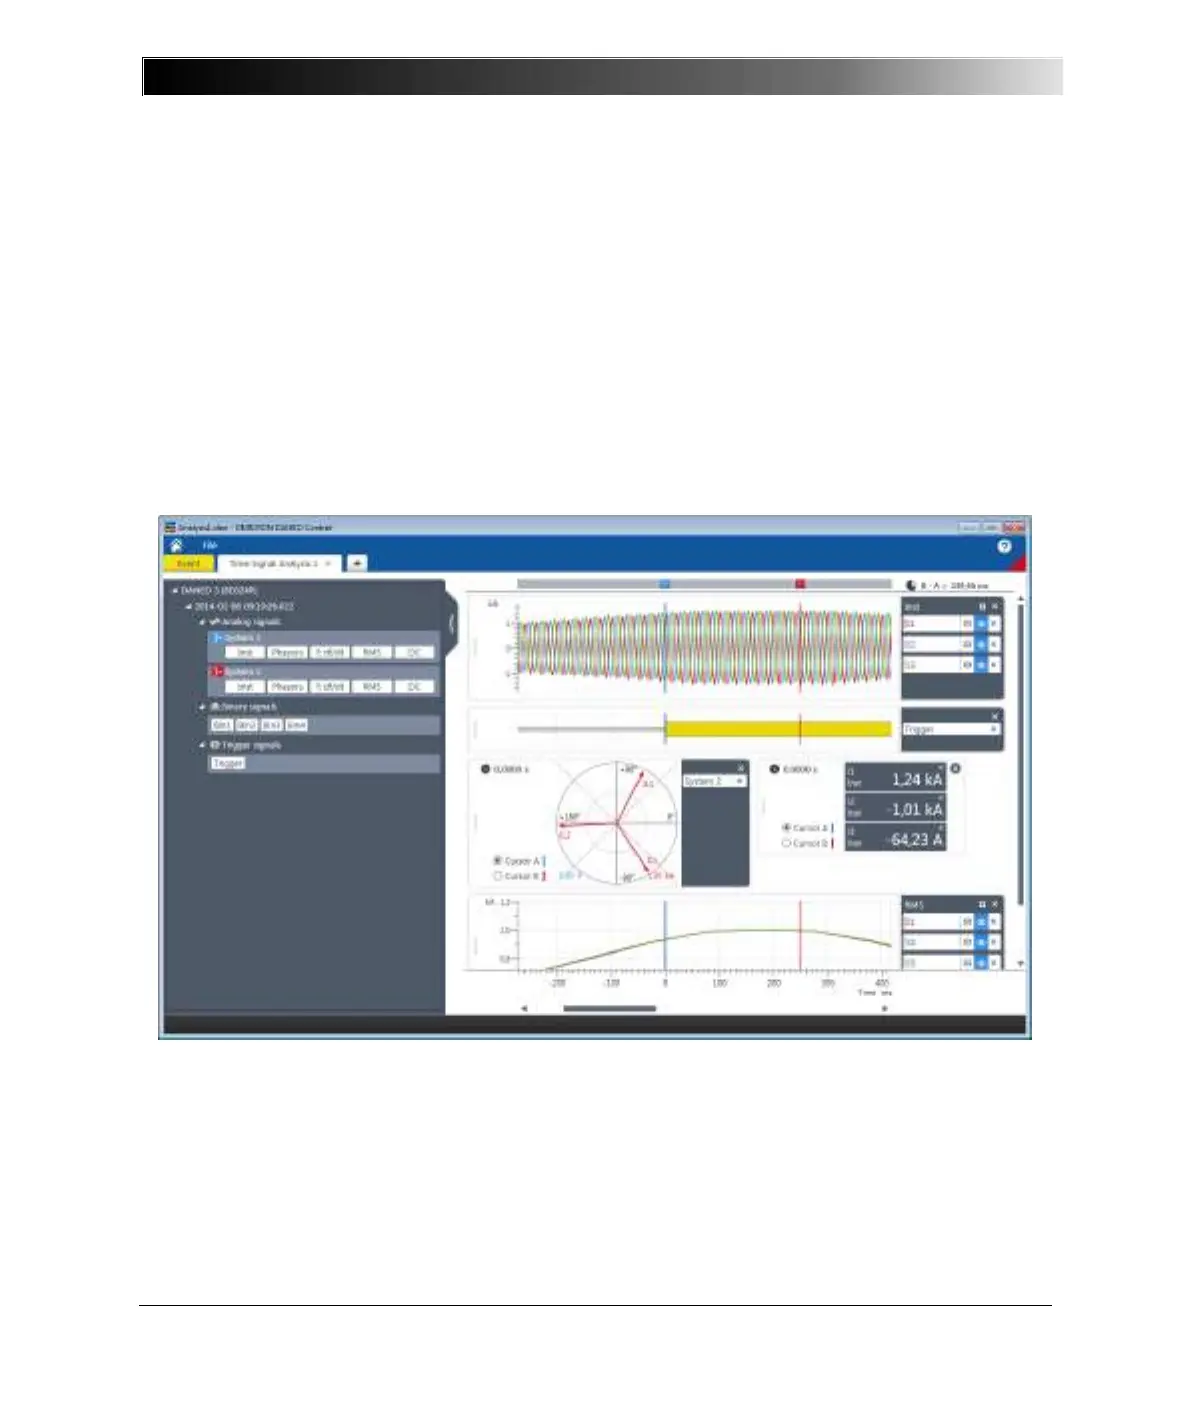
The following figure shows an example of a time signal analysis displaying analog and binary signals.
Figure 25: Example of a time signal analysis
The cursor diagram shows the signal’s values and/or components at the selected cursor’s position.
The calculation diagram can additionally perform basic calculation operations (addition, subtraction,
division, multiplication) based on the cursor position values.
The GOOSE packets diagram is available for mapped binary signals from GOOSE. It displays
information about the GOOSE packet that caused the current state of the binary signal at the selected
cursor.
 Loading...