DSPEC 50
®
and DSPEC 502
®
Digital Gamma-Ray Spectrometer User’s Manual 932502G / 0618
be expressed as ± with a 1-sigma confidence limit, where N is the corrected
spectral data and V is the variance (error) spectral data.
The live time is set to the real time within the analysis engine during the analysis of ZDT
spectra.
A CORR_ERR spectrum is analyzed
8
as a regular spectrum most of the time, with a few
exceptions as listed below.
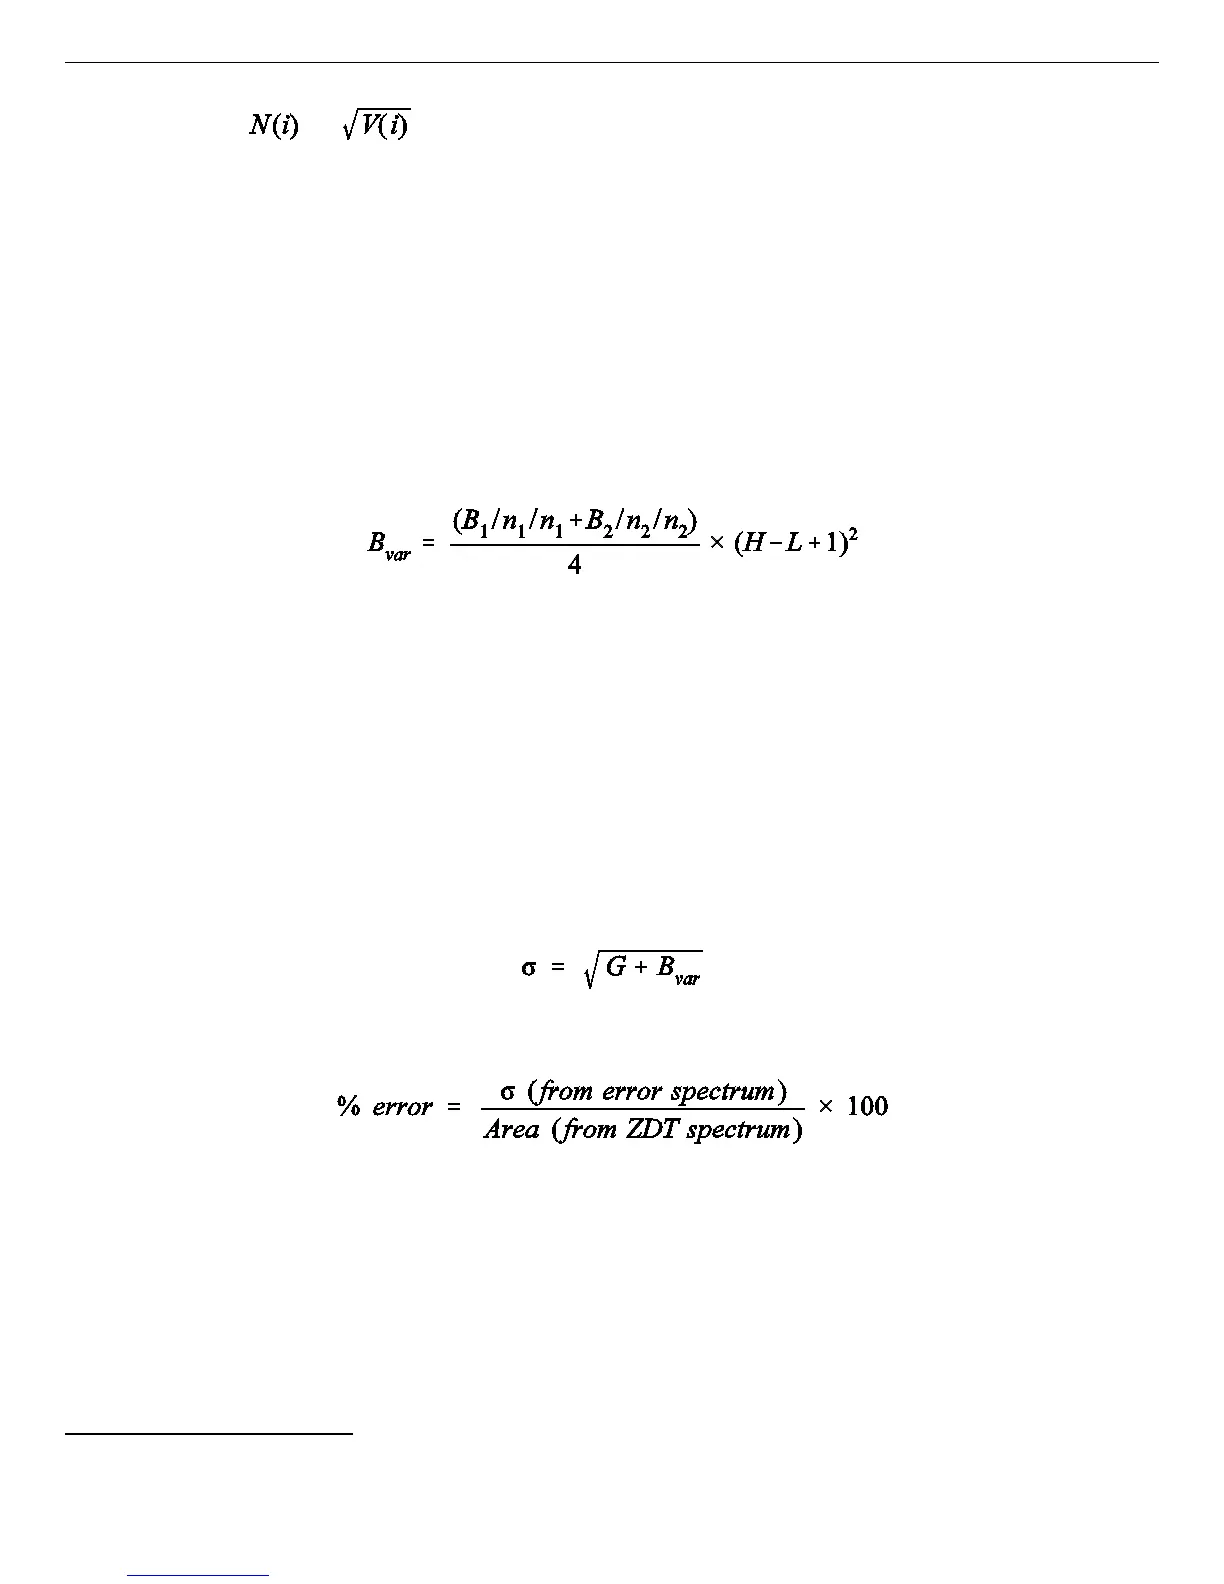
! To calculate the peak area uncertainty, the error spectrum is used. If the peak limits are
from L and H channels, then the background variance is calculated as:
where:
B
1
= sum of background counts for the channels adjacent to the peak start (low-
energy) channel L
B
2
= sum of background counts for the channels adjacent to the peak end (high-
energy) channel H
n
1
= the number of low background points (n
1
= 1, 3, or 5) used
n
2
= the number of high background points (n
2
= 1, 3, or 5) used
The peak area uncertainty is calculated from:
where G is the sum of counts, from the error spectrum, from channels L to H.
! In our WAN and ISOWAN analysis engines, the peak-fitting routine fits all the library
peaks as singlets to calculate the peak centroid, peak start and end channels, and peak
background. A linear background under the peak is assumed during the peak fitting
process.
8
Using our gamma-ray spectrum analysis software such as GammaVision
®
or ISOTOPIC.
12
 Loading...