932502G / 0618 2. THE DSPEC 50
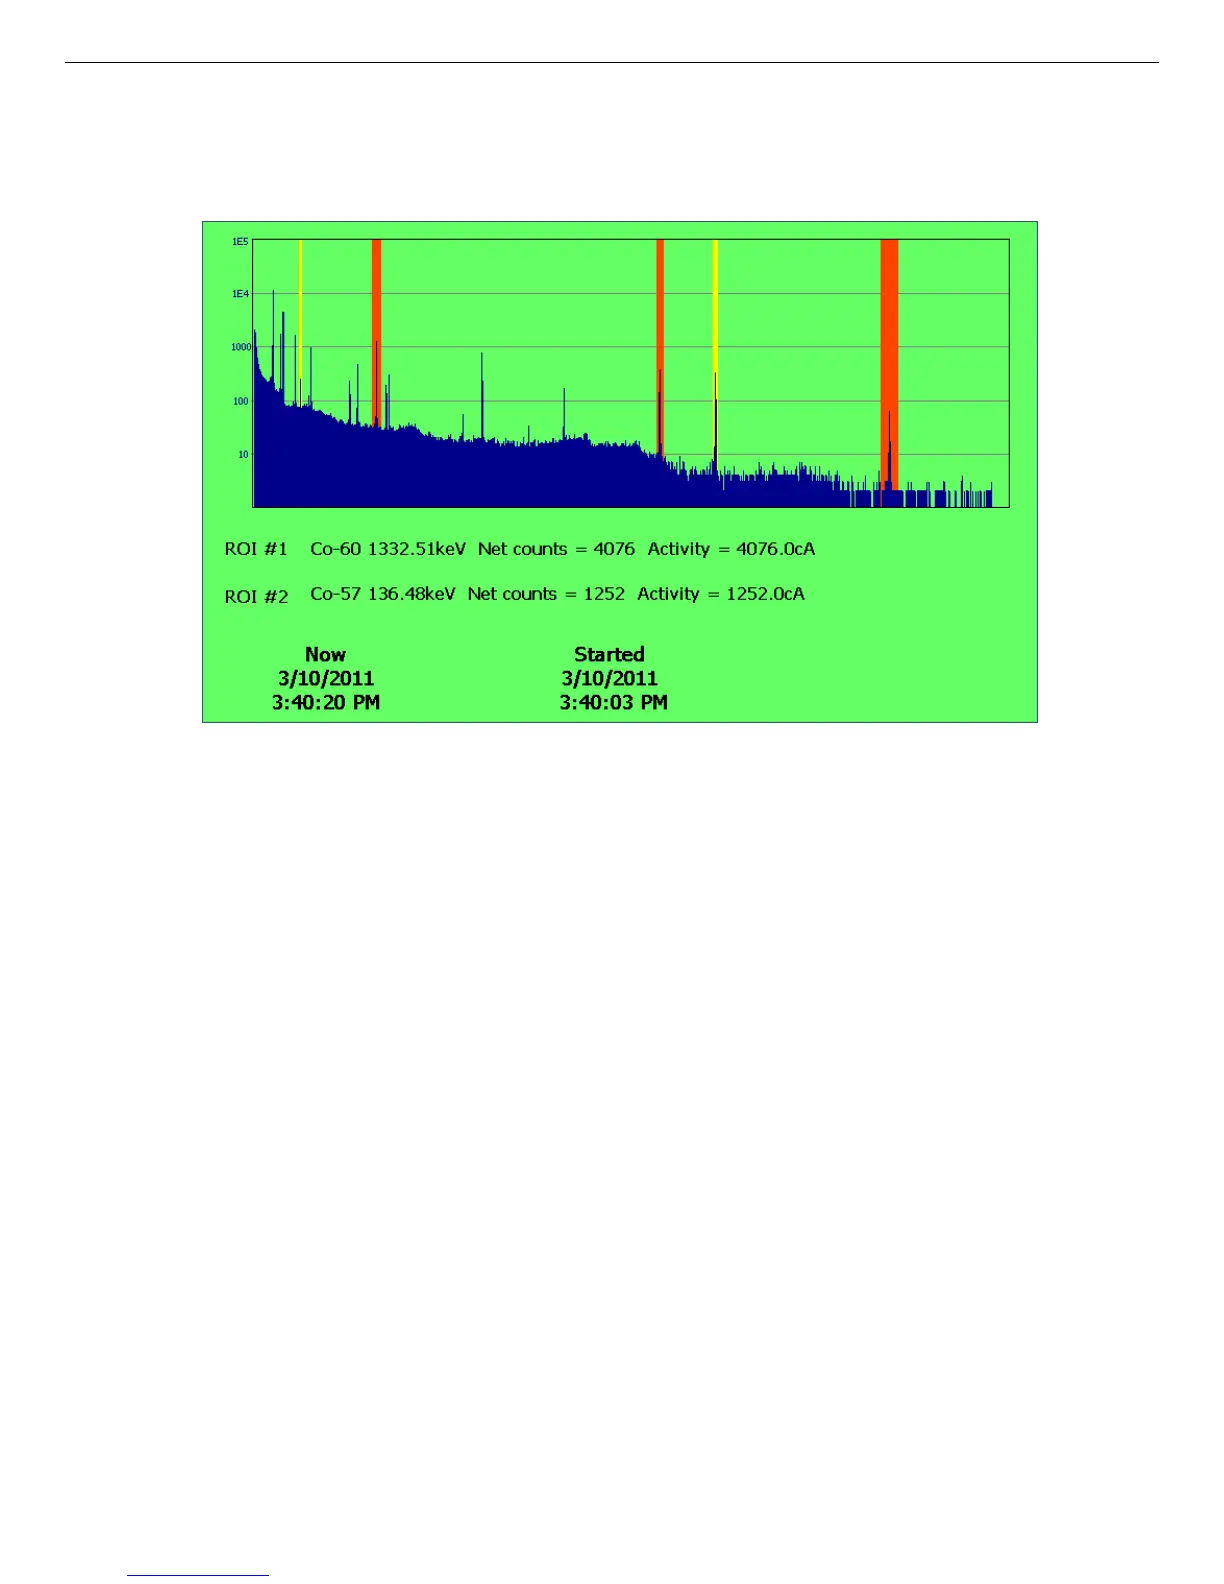
Figure 13. Spectrum Screen (Nuclide Report ROIs are yellow with activity
readouts below spectrum; “standard” MAESTRO ROIs are orange with no
readouts).
2.1.5.3. The Spectrum Screen
This screen (Fig. 13) displays the spectrum for the current or most recently acquired spectrum.
If any Nuclide Report ROIs have been defined (see Section 4.11), the two lowest-energy ROIs
are marked with a yellow background, and an activity readout for each is displayed below the
histogram. See the two yellow ROIs in Fig. 13. Figure 14 shows the Nuclide Report setup tab
for these two ROIs.
If “standard” ROIs have been defined in an ORTEC spectroscopy application, using the com-
mands on the ROI menu, they are indicated with an orange background on the DSPEC 50
spectrum screen. See the three orange ROIs in Fig. 13 and refer to the ROI Mark command in
the software user manual.
For comparison to the Spectrum screen, Fig. 15 shows the corresponding spectrum and
“standard” ROIs in GammaVision.
25