DSPEC 50
®
and DSPEC 502
®
Digital Gamma-Ray Spectrometer User’s Manual 932502G / 0618
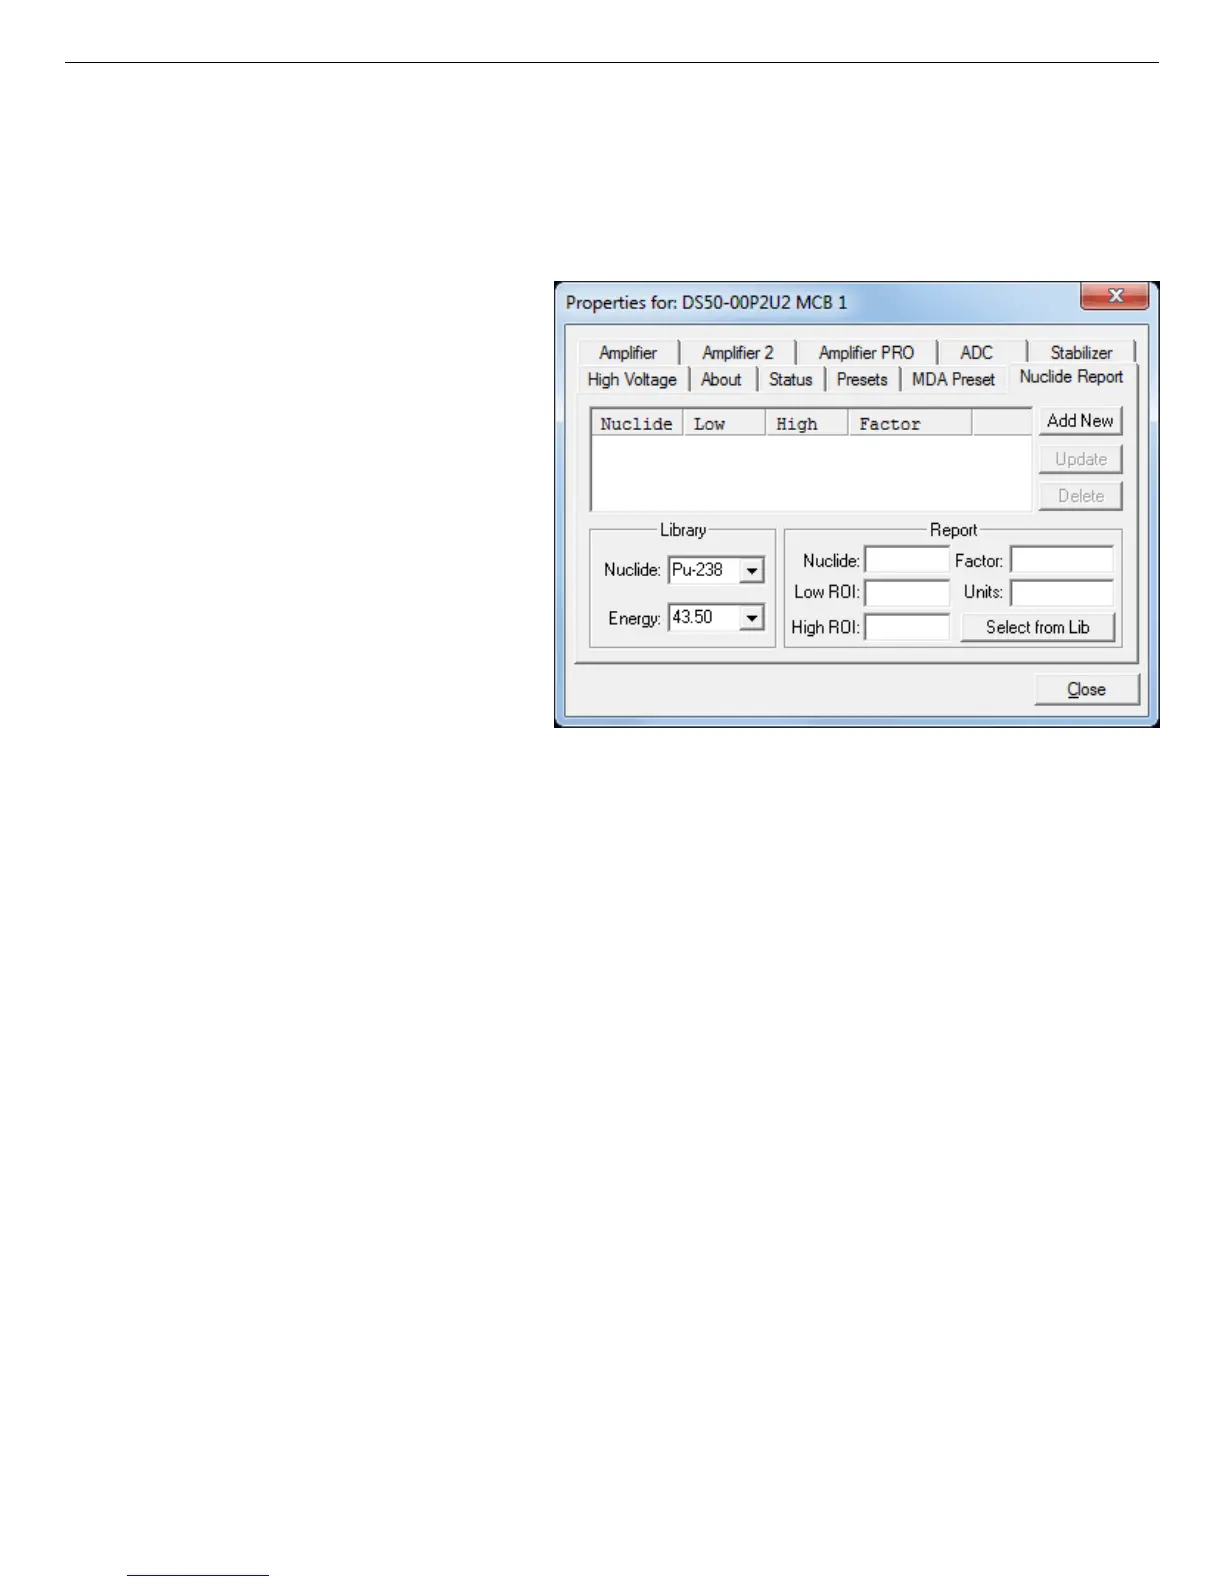
Figure 47. Nuclide Report Tab.
presets specific to that geometry, efficiency calibration, and nuclide library.
You can then recall this tailored analysis options file as needed.
4.11. Nuclide Report Tab
Figure 47 shows the Nuclide
Report tab. The Nuclide Report
displays the activity of up to nine
(9) user-selected peaks. Once the
report is set up, the two lowest-
energy ROIs and their respective
activity readouts are displayed
on the DSPEC 50's Spectrum
screen.
The peak area calculations in the
hardware use the same methods
as the MAESTRO Peak Info
option (see the MAESTRO user
manual), so the Nuclide Report
display is the same as the Peak
Info display on the selected peak in the spectra stored in the computer. The calculated value is
computed by multiplying the net peak count rate by a user-defined constant. If the constant
includes the efficiency and branching ratio, the displayed value is the activity. You enter the
nuclide label and the activity units. The report format and calculations are discussed in
Appendix D.
IMPORTANT The entries you make on this screen are saved in the MCB memory, and are
not dynamically calculated. If you change the energy calibration (i.e., if the
peak locations shift), the Nuclide Report may no longer be valid.
4.11.1. Add New
You can add Nuclide Peaks to the report manually or by selecting the peaks from the current
working library. The spectrum must be energy calibrated to use the library method.
4.11.1.1. Defining Peaks Manually
To manually define peaks, enter the Nuclide name, ROI Low (start) and High (end) channels,
multiplicative Factor and Units in the Report section; then click Add New. All nuclides in the
table use the same units, so that value need only be entered once.
58