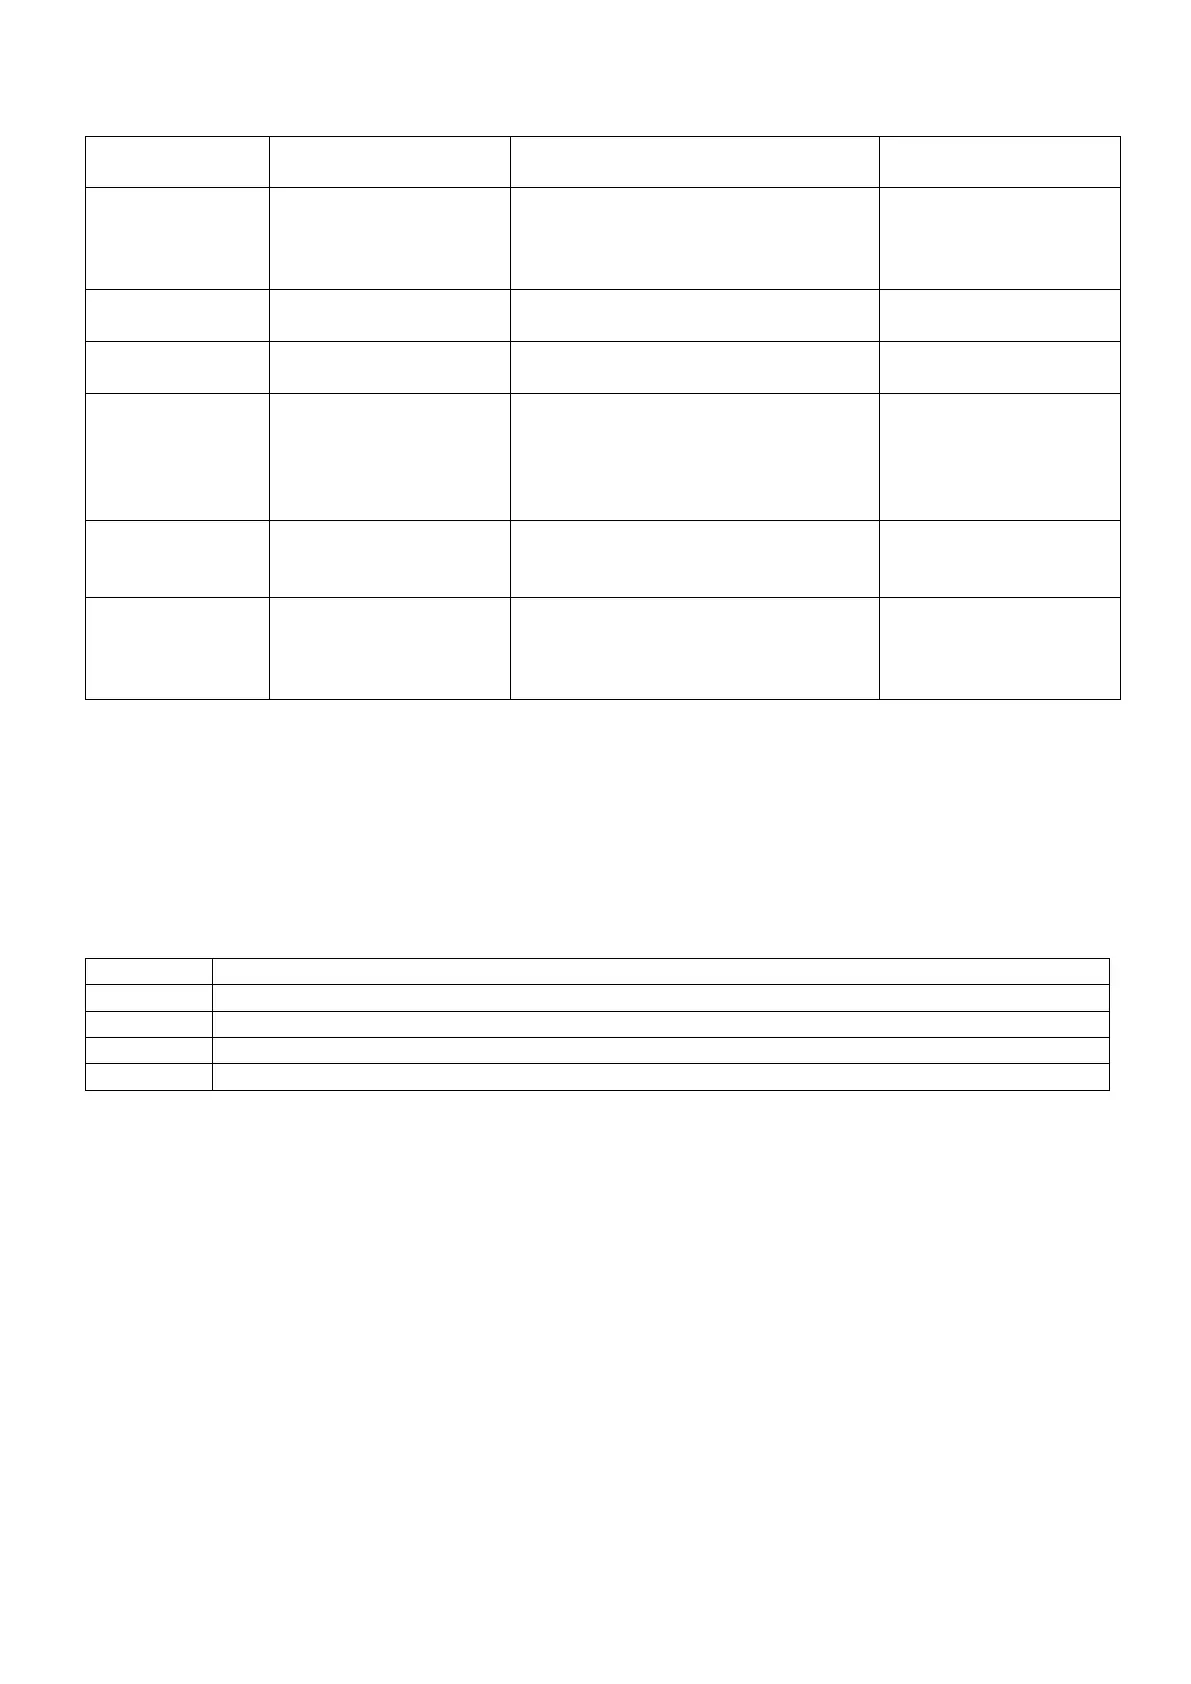
The table below gives a survey of the aspects of Power Quality Monitoring:
Probability 100%: upper & lower
limits
Probability x %: upper & lower
limits
Probability 100%: upper limit
Probability x %: upper limit
Probability 100%: upper limit
Probability x %: upper limit
Dips/
Interruptions/
Rapid Voltage
Changes/
Swells
4,
one for each
parameter covering all
3 phases
Probability 100%: upper limit
Probability x %: upper limit
1,
measured on
Reference Voltage
Input A/L1
Probability 100%: upper & lower
limits
Probability x %: upper & lower
limits
Power Quality main screen
Power Quality Monitoring is reached via the 【MONITOR】key, and Immediate or Timed start is
settable. With the direction keys you can position the Cursor on a particular Bar Graph. Measuring data
belonging to the bar is shown in the screen header.
Detailed measurement data is available under the Function keys:
RMS voltage: events table, trends.
Harmonics: bar graphs, events table, trends.
Flicker: events table, trends.
Dips/Interruption/Rapid Voltage Change/Swells: events table, trends.
Unbalance, frequency: events table, trends.
The measuring data available under the Function keys is explained in the following sections. Data is
presented in the formats Events Table, Trend Display and Bar Graph Screen.
-68-