HAFFMANS c-DGM/i-DGM
Page 34 of 78 c-DGM/i-DGM
The figures below show the sequence of displays for a measurement :
O
2
ppb
LIQ
T: 5.2 P: 1:03 AM O: 77
Fig. 6.5 Oxygen content display
BUSY MEASURING...
PROGRESS:
T: 5.2 P: 1:03 AM O: 77
Fig. 6.6: Display during electrolysis
Tel.
o
C
T: 5.2 P: 1:03 AM O: 77
Fig. 6.7: Display during temperature measurement
p
bar
T: 5.2 P: 1:03 AM O: 77
Fig. 6.8: Display during pressure measurement
CO
2
g/l
T: 5.2 P: 1:03 AM O: 77
Fig. 6.9: Display after CO
2
calculation
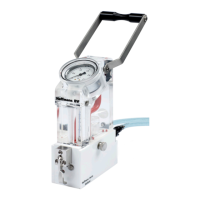
As soon as the last samples have been measured, the DGM must be rinsed with cold water.
Store the DGM with handle depressed and filled with water.
 Loading...