© PSI (Photon Systems Instruments), spol. s r. o.
46
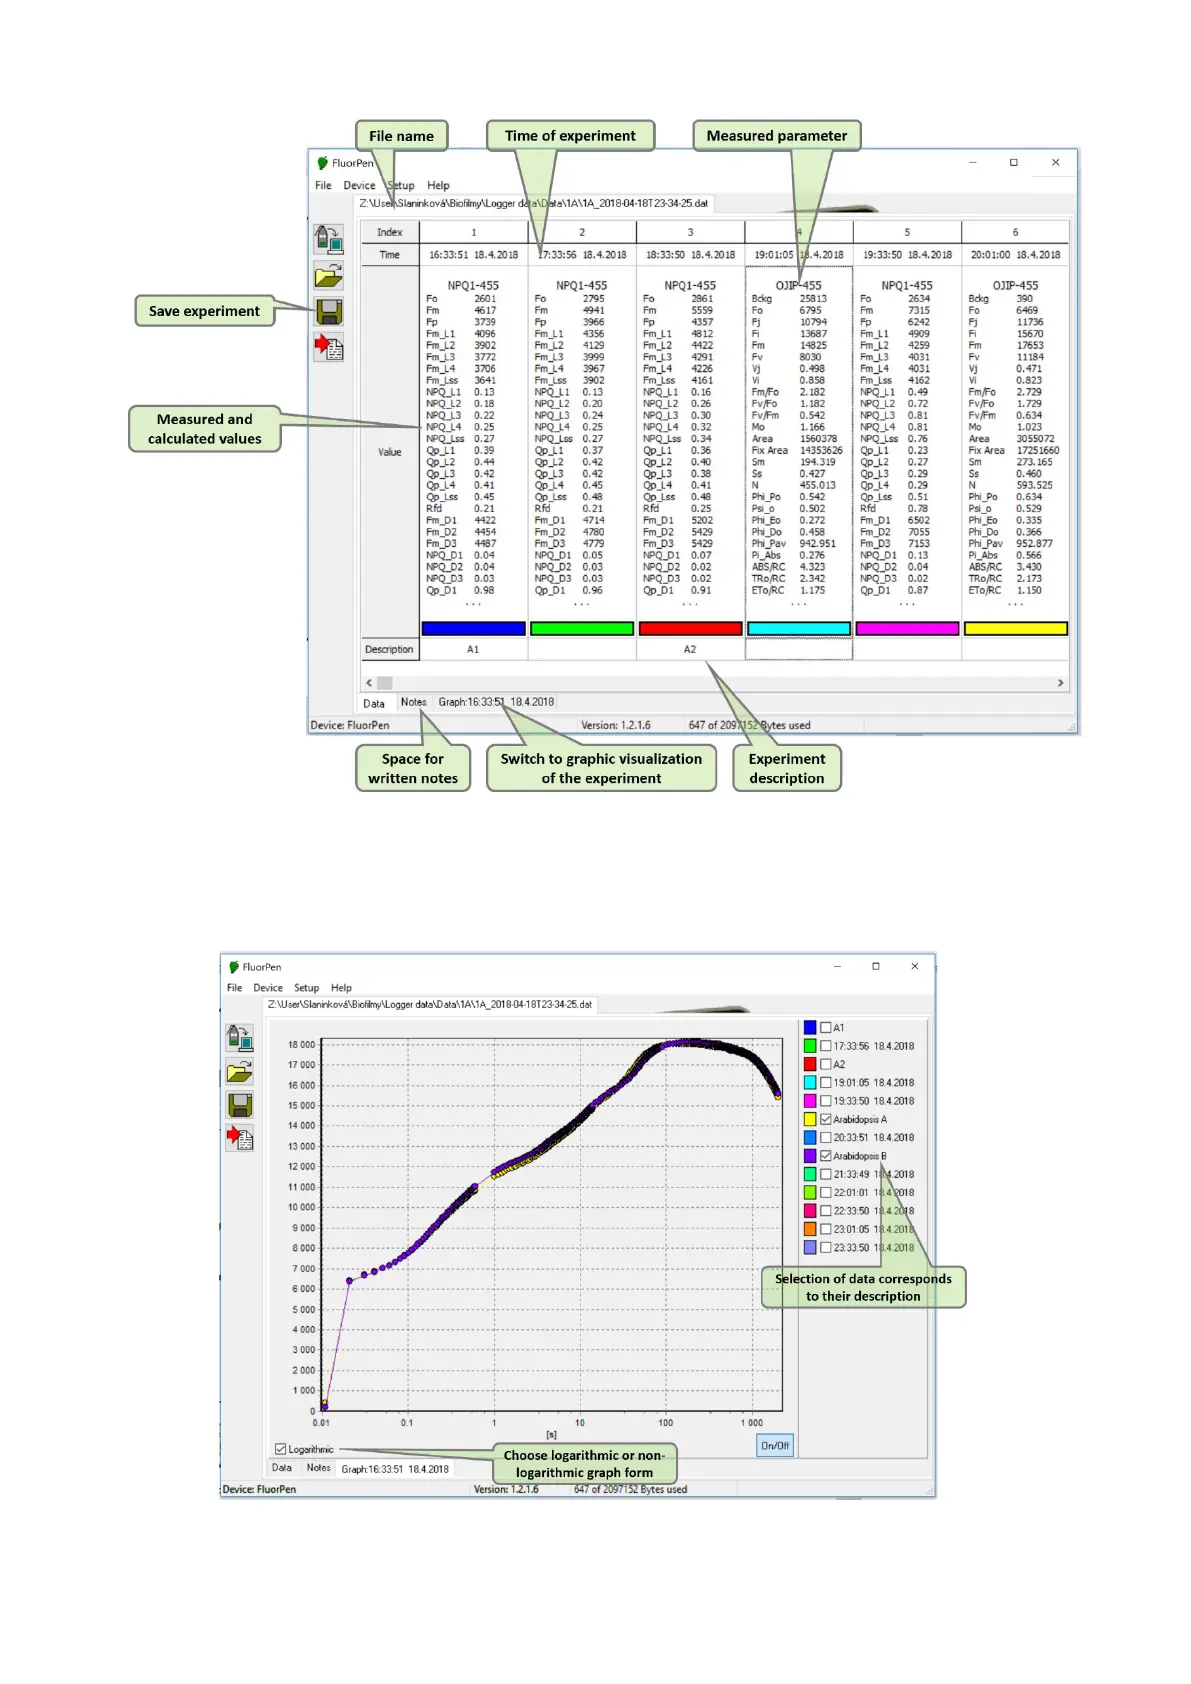
Fig. 21 Example of Data Transfer and Visualization.
4. To visualize the data in the graph mode, click the Graph field in the bottom bar.
5. The selected set of data will be shown on the graph (Fig. 22).
Fig. 22 Graphic visualization of experiment.