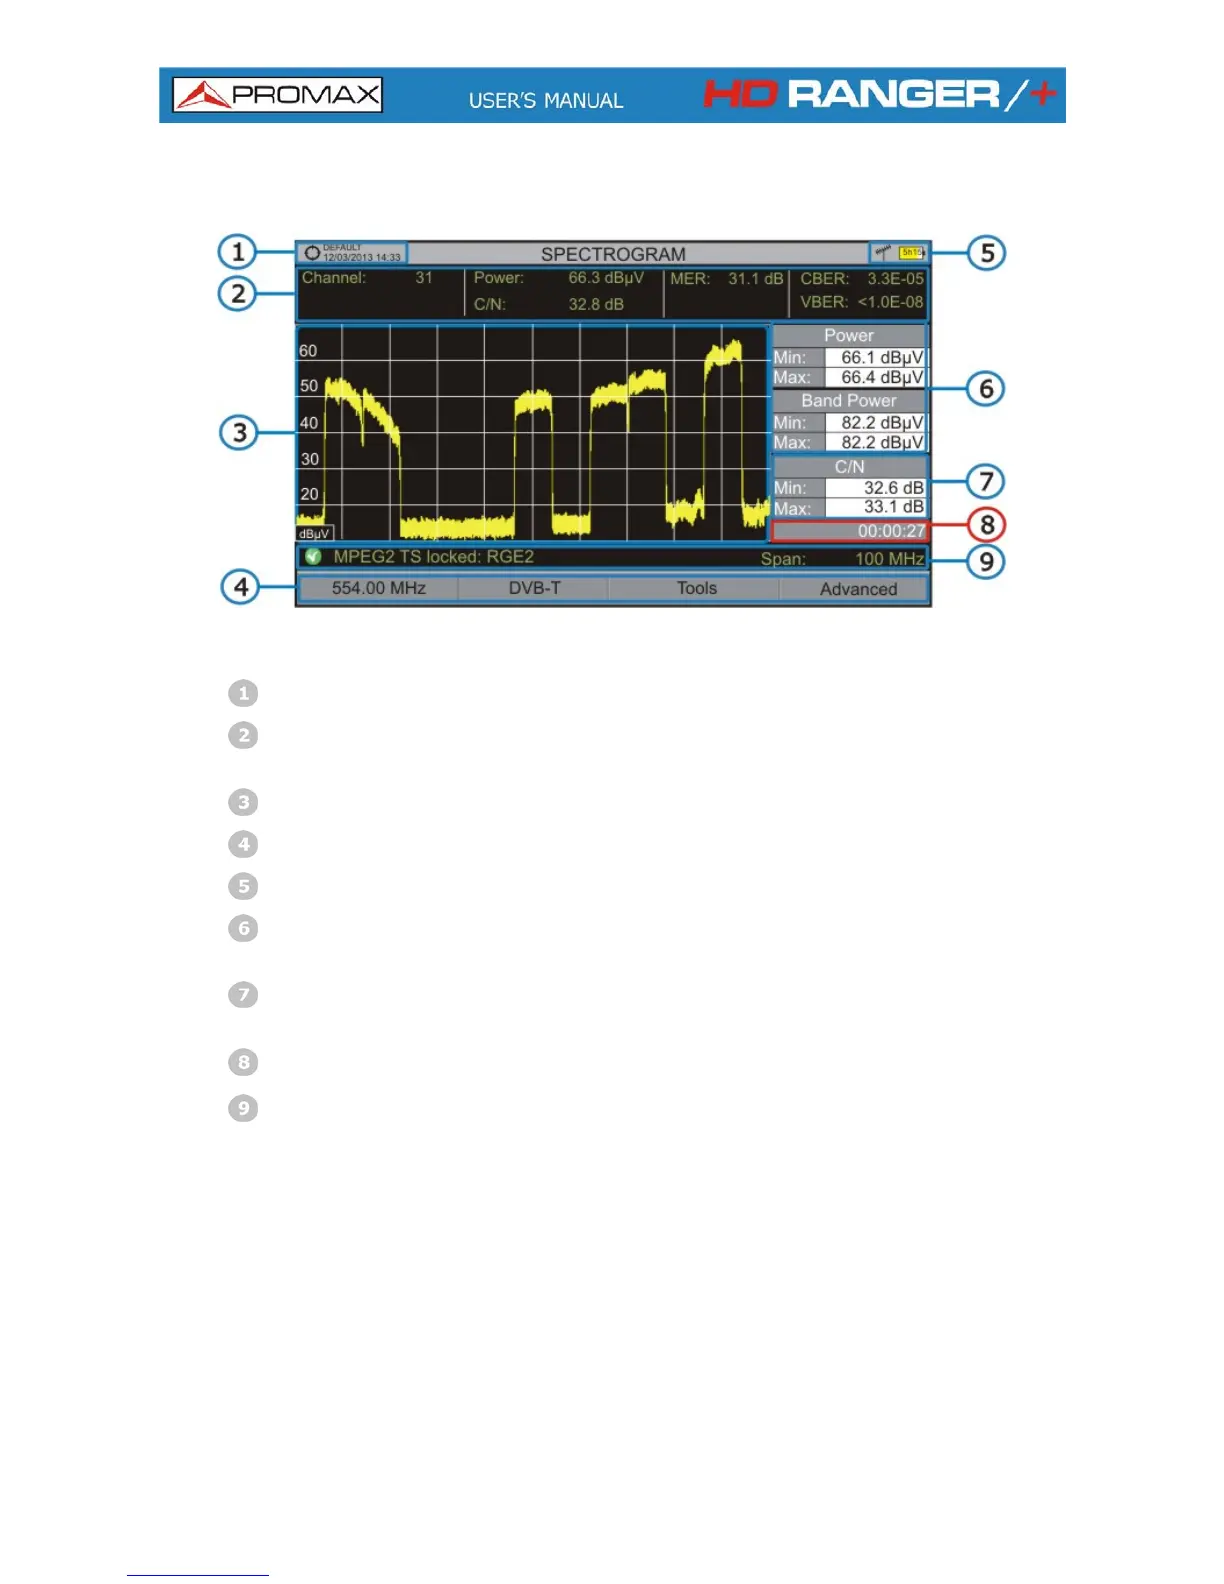
The following describes the SPECTROGRAM screen:
Figure 45.
Selected installation; date and time.
Measurement values for the signal tuned at the frequency/channel
selected.
Spectrum over time at the selected span.
Softkeys menus.
Selected band, battery level.
Maximum and minimum values of signal power and band power over
time.
Maximum and minimum value of the measure selected by the user in the
option "User measure".
Elapsed time.
Signal status (searching / locked / multiplex name / selected span).
X Axis: Span (MHz)
Y Axis: Power
► Joystick does not have any function in this tool.
6-70
April 2013



 To Next Page