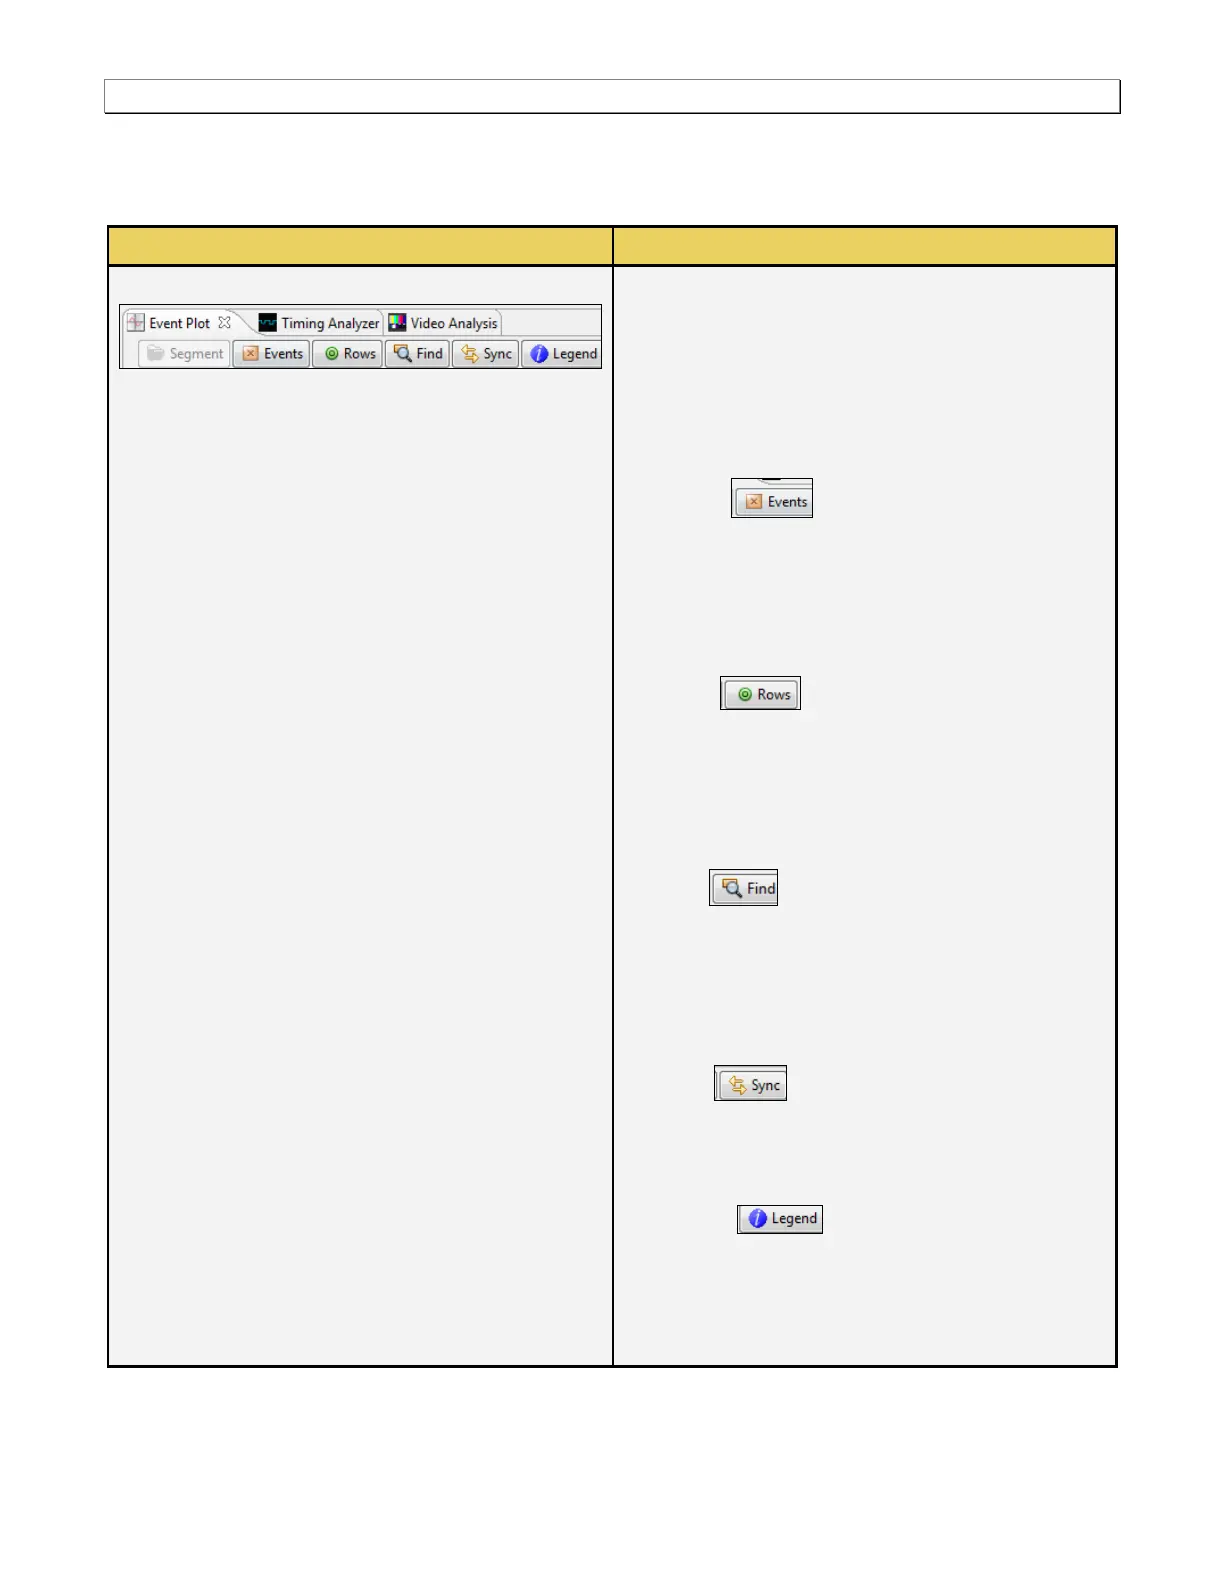
Segment – Large captures are broken into smaller
distinct sections called segments to make them
more manageable and to improve speed and
performance. When you click on the Segment
activation button, a dialog box appears enabling
you to select and load another segment. This
dialog box is described further below.
Events – The Events activation button
enables you to filter the captured data by type.
When you click on the Events button a dialog box
appears enable you do select or deselect data
types individually or a page at a time. This dialog
box is described further below.
Rows – The Rows activation button
enables you to configure the data types that
appears in the Event Plot window. When you click
on this icon a dialog box appears enabling you to
configure the rows. This dialog box is described
further below.
Find – The Find activation button
enables you to locate captured data by type.
When you click on the Find button a dialog box
appears enable you do specify a data type to
search on. This dialog box is described further
below.
Sync – The Sync activation button
enables you to synchronize the Data Decode and
the Timing Analysis panels to the data in the Event
Plot panel.
Legend – The Legend activation button
enables you to view the color coding for the data
packets appearing in the Event Plot. When you
click on this icon a panel appears enabling you to
view the color codes. This panel is shown below.