980 User Guide Rev. B29
Page 63 August 5, 2011
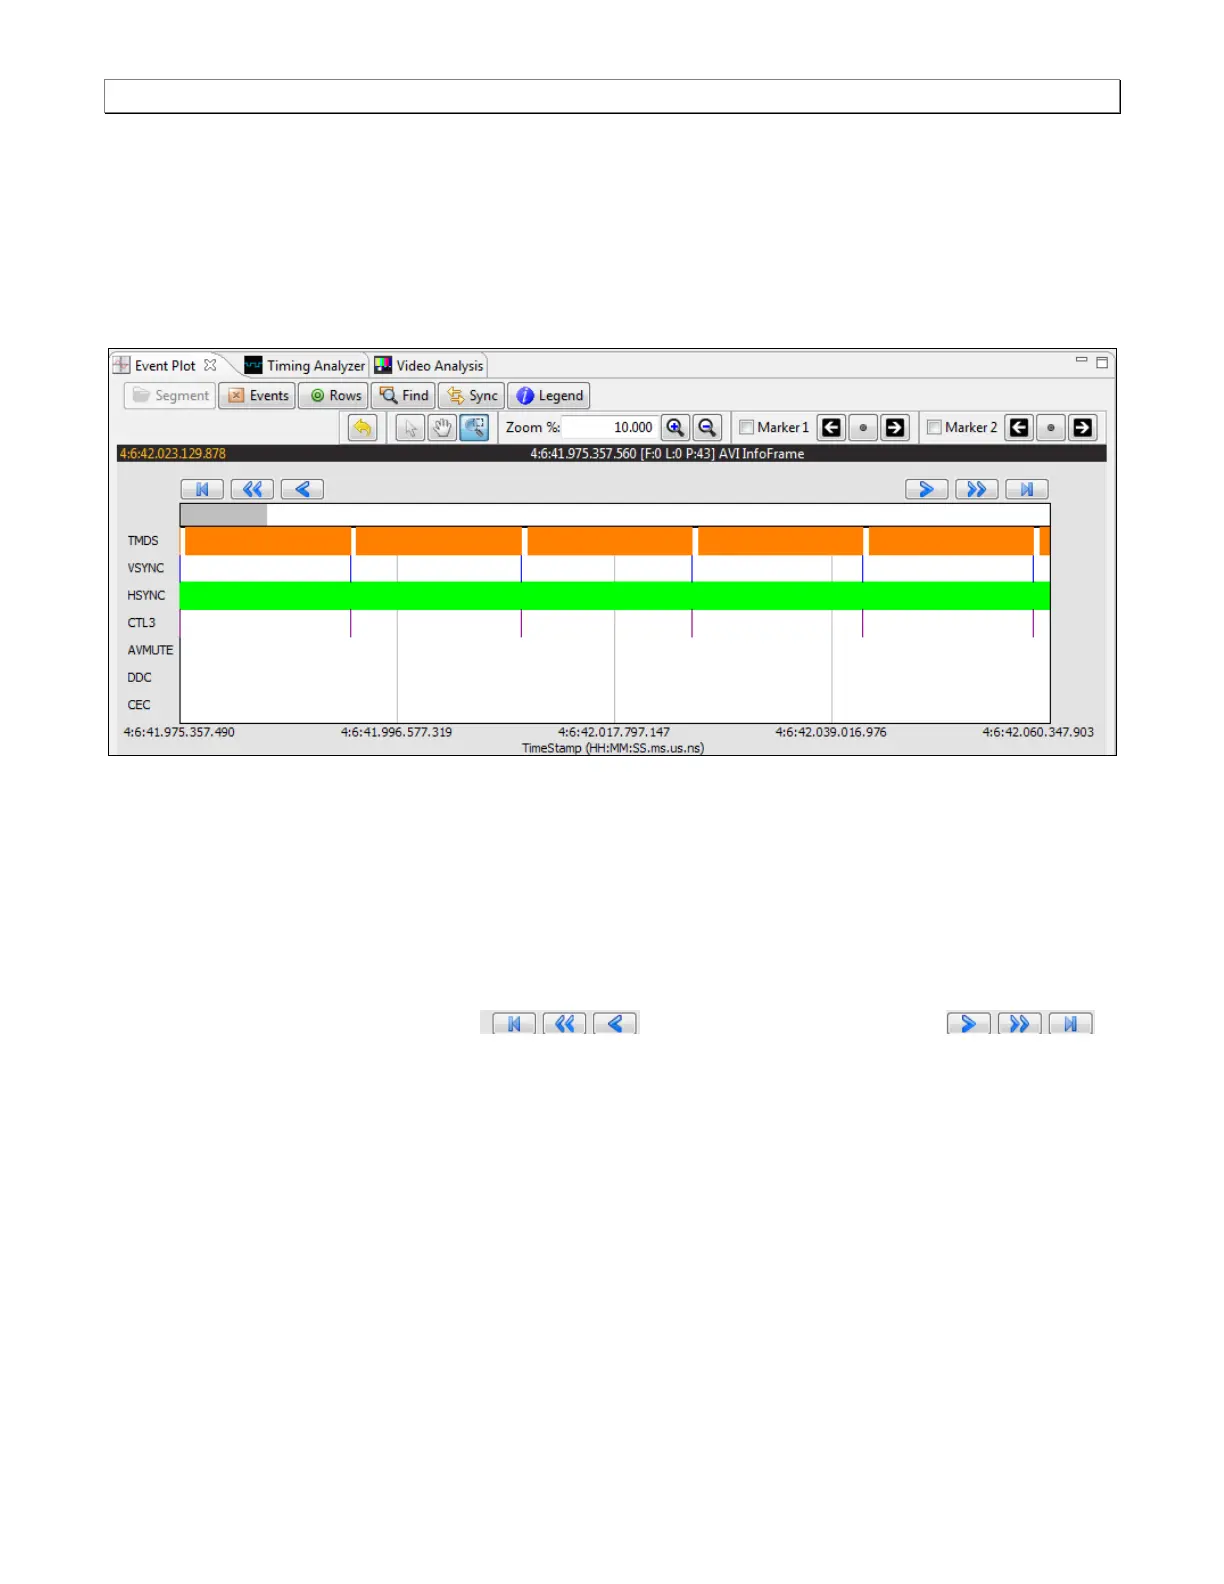
4.5 Event Plot Panel
The Event Plot panel (shown below) is the primary panel for locating the data for high level navigation to the detail
level provided by the Data Decode panel. The vertical axis is the data types. The Event Plot panel provides a set
of data types labeled on the left of the panel that inform you of the type of data for that layer. (You can change this
configuration.) The horizontal axis is time. The scale along the bottom of the Event Panel shows the timestamp for
each point in time.
4.5.1 Locating Data in the Event Plot Panel
The Event Plot enables you to locate data by searching for specific data types, panning, scrolling and zooming
using various techniques. You can filter the data by type to limit the amount of data to sift through. You can
synchronize the Data Decode and Timing panels to the Event Plot or you can synchronize the Event Plot to the
Data Decode panel.
A scroll bar is provided to enable you to quickly browse through the data. The scroll bar is under the set of function
icons just above the data panel where the data is displayed. You can also scroll to the end, scroll by page or scroll
incrementally in either direction using the backward and forward activation
buttons. See the screen shot below.